
Datos de ciencia ciudadana sugieren un decremento en la diversidad de insectos de México, país megadiverso
Jorge Soberon *
University of Kansas, Biodiversity Institute, Dyche Hall, 1345 Jayhawk Blvd, Lawrence, KS 66045, USA
*Corresponding author: jsoberon@ku.edu (J. Soberon)
Received: 09 July 2025; accepted: 26 August 2025
Abstract
An analysis of iNaturalist data on several taxonomic groups of insects in Mexico is presented. A decreasing trend was observed in species diversity per year for 4 families of butterflies, bumblebees, and dragonflies and damselflies. Analyses were performed on several potential vegetation types (sensu Rzedowsky), and the roles of deforestation and pesticide use on the identified trends were explored. Challenges in using unsystematic data to estimate trends are discussed, and several hypotheses are provided to explain the results.
Keywords: Butterflies; Bumblebees; Damselflies; Dragonflies, iNaturalist
Resumen
Se presenta un análisis de datos de iNaturalist sobre varios grupos taxonómicos de insectos en México. Se observó una tendencia decreciente en la diversidad de especies por año para 4 familias de mariposas, y para abejorros y libélulas. Se realizaron análisis sobre varios tipos potenciales de vegetación (sensu Rzedowsky) y se exploró el papel de la deforestación y el uso de pesticidas en las tendencias identificadas. Se discuten los desafíos del uso de datos no sistemáticos para estimar tendencias y se presentan varias hipótesis para explicar los resultados.
Palabras clave: Mariposas, Abejorros; Caballitos del diablo; Libélulas; NaturaLista
Introduction
Evidence indicates a decrease in insect populations in many countries (Edwards et al., 2025; Hallmann et al., 2017). This finding is worrisome for many reasons, including that insects are key components of ecosystems and provide societies with important ecosystem services, such as pollination (Potts et al., 2010). Moreover, insects have substantial but largely unappreciated cultural importance (Duffus et al., 2021), not only worldwide but particularly in countries such as Mexico, where insects have culinary uses (Ramos-Elorduy & Viejo-Montesinos, 2007), have been important for ancestral cultures (Beutelspacher, 1989), and have economic and societal value (Ayala et al., 2012; Rogel-Fajardo et al., 2011).
Most detailed evidence of the decline in insects has come from countries in temperate zones that have developed formal monitoring schemes (Streitberger et al., 2024; Thomas, 2005). In contrast, tropical regions are less well studied (Sánchez-Herrera et al., 2024), and the existing evidence is contradictory (Bonadies et al., 2024; Boyle et al., 2025; Wagner et al., 2021). For instance, studies on Hemiptera (Lucas et al., 2016) and on saturniid moths (Basset et al., 2017) have indicated no trends in Barro Colorado Island, Panama. Similarly, in Veracruz, Mexico, well monitored fruit flies have shown no trends (Aluja et al., 2012; Ordano et al., 2013). In contrast, decreases in saturniid larvae have been reported in Costa Rica (Salcido et al., 2020), and declines in arthropod biomass have been reported in Puerto Rico and, on the basis of a few data points, in Chamela, Mexico (Lister & García, 2018). The monarch butterfly, perhaps the best monitored insect species in Mexico, has shown consistent decreases in its wintering aggregations (Thogmartin et al., 2017; Vidal & Rendón-Salinas, 2014; Zylstra et al., 2021).
Because of its history, climate, topography, and cultural milieu (Ramamoorthy et al., 1993), Mexico is among the world’s megadiverse countries (Mittermeier et al., 1997). Therefore, assessing the trends in insect populations in Mexico should be prioritized. Unfortunately, long-term insect monitoring in Mexico is rare. Although Mexico has a long history of entomological research, including many collections and hundreds of publications (Michán & Llorente, 2002), monitoring has been limited to only a few species. Although the reasons for the lack of national monitoring schemes like those existing in other countries should be determined, this study does not attempt to do so. It takes as a premise that, in Mexico, just a few systematically obtained insect time series of more than 2-3 years long are available. This study is aimed at estimating insect biodiversity trends in Mexico, despite the absence of systematic monitoring efforts.
Systematic monitoring results are compiled in several worldwide time series databases, such as the Living Planet Index (Almond et al., 2020) and the Global Population Dynamics database (NERC Centre for Population Biology, 1999). Unfortunately, these databases have sparse insect information and contain no data for Mexico. Another possibility is using so-called citizen science (CS) data (Cohn, 2008), which, although opportunistic and unsystematic, is often abundant. Data on insects collected by non-professionals have been used to estimate phenology and distributions (Soroye et al., 2018). However, using such data to estimate population trends is challenging, as discussed below.
In Mexico, perhaps the most comprehensive CS initiative is iNaturalist (known as Naturalista in Mexico). iNaturalist began its operations in Mexico in 2008, although in 2013 the initiative came under the leadership of the national biodiversity agency, Conabio, under the name of Naturalista (Macías & Freire, 2017) and obtained funding from the Slim Foundation. Therefore, in Mexico, iNaturalist began in earnest in 2013. Despite this relatively late start, Mexico is the third country in amount of data (Mason et al., 2025) and it contains more than 80,000 records tagged as “research level” for 3 families of butterflies, and the damselflies, dragonflies, and bumblebees. This substantial information may be used to assess trends. However, CS data must be corrected for biases, of which are many (Crall et al., 2011). Specifically, in Mexico, the number of observers (and thus of observations) in iNaturalist increases each year (Table S1), and this bias should be considered when using such data.
Indeed, a major problem in using opportunistic CS data to estimate trends is correcting for biases in recording efforts (Di Cecco et al., 2021). Several methods can be used to address this problem (Isaac et al., 2014; Outhwaite, 2019; Tang et al., 2021). One of the simplest methods is correcting bias by obtaining the quotient of the metric used to report biodiversity to some measure of the effort invested in a locality, for a given period. What is “effort,” and how can it be measured in iNaturalist data? Collection effort is difficult to define but can be described in terms of: 1) the time spent collecting, 2) the method of collection and number of collectors, or 3) the number of specimens or species observed (Gulland, 1969; Willott, 2001). iNaturalist data allows for extraction of a measure of time (number of monthly observations in a year), but data quality (beyond the “research” tag, which refers to the reliability of the name assigned to the species), remains unreported, and worse, in the case of iNaturalist, this quality is known to change (Di Cecco et al., 2021). Di Cecco (2021) has suggested that, in iNaturalist, observers with at least 2 observations are more reliable than those with just 1 observation. Therefore, as a measure of effort, this study used the number of observers with 2 or more observations. As biodiversity measures it is used the number of species, and the number of observations, pooled for spatial units and year. Two indices are then calculated: number of species/effort, and number of records/effort.
Ordinary regressions of metrics against time often experience problems of autocorrelated errors and non-equal variances (heteroskedasticity). These are characteristic of time series (Shumway & Stoffer, 2005) and must be accounted for. One method of addressing the complexities of analysis of count time series data is using a package such as “trim” (in the R platform), which assumes a Poisson model for the underlying data (Pannekoek, 1998). This approach corrects for the autocorrelation of errors and for heteroskedasticity. Trim has frequently been used for European (van Strien et al., 2019) and tropical American (Novoyny & Basset, 2000) data, but the key assumption of count data (a discrete scale) complicates analysis of continuous-scale indices, or data including many non-occurrences, because the software is sensitive to the presence of zeroes, or NAs, in the data.
Another possibility is estimating whether a significant trend exists in the data, by using a non-parametric Mann-Kendall test (Lyubchich et al., 2013). An ordinary least squares linear regression (OLS) of metric against time is first performed, and the existence of trends (linear or monotonic) is subsequently determined. This method uses the sign of the slope in the OLS, and the significance is tested with the Mann-Kendall test.
Additional methods can be used, such as, for a single species, the logit of the probability of occupancy of a cell, on a time unit (van Strien et al., 2019) and fit a generalized linear model of predictors, by using the length of the list of species as a measure of effort (Szabo et al., 2010). Then several single species regressions can be combined in an index (van Strien et al., 2019). One problem with this approach is that generalized linear modeling is based on an assumption of independence of errors, which might be violated in a time series.
A statistically more sophisticated modification of the above idea is reporting the proportion of occupied sites under a hierarchical model that separates the actual presence from the act of observation (Outhwaite, 2019). Although apparently very rigorous, this approach has its own problems, including the need to define an appropriate model for the “present” and “observer” components, and the need to have replicated visits to the same site within the same season (van Strien et al., 2019).
Another possibility is using generalized least squares (GLS) regressions, which allow for autocorrelated errors and heteroskedasticity. The R package “nlme” implements this technique. This method can fit an ordinary regression of the index against covariates such as time, and another regression including autocorrelation with power variance decay in its model. Subsequently, the 2 models can be compared with the Akaike criterion, and the best model can be retained. This option was used here, with the simplest ARIMA model with lag = 1 as a model of correlated errors.
This study further assessed whether any existing trends might have differed for different ecological regions of Mexico. A variety of subdivisions of Mexico have been suggested, according to different ecological perspectives, at different spatial resolutions (Anonymous, 1997; Challenger & Soberón, 2012; Miranda & Hernández, 1963; Olson et al., 2001). Here, Rzedowsky’s potential vegetation types were used (Rzedowsky, 1986). Although coarse-grained, these types are based primarily on straightforward floristic criteria, are well known in Mexico, and have a small number of categories.
An important caveat in using CS data is that species that are difficult to identify by sight should be avoided. This work focused on 3 families of butterflies (Papilionidae, Pieridae, and Nymphalidae), with 316 names (skippers and the smallest families in the Papilionoidea were excluded); 23 names for bumblebees; and 293 names for the Odonata (both Zygoptera and Anysoptera). In addition, as a comparison, data on 307 names for Solanaceae were included. The numbers of names (without proper taxonomic validation by experts), as reported by iNaturalist, are listed in Table 1.
For the butterflies, although using species identified as indicators of “conservation” status (Orta et al., 2022) would have been interesting, most species identified by these authors as indicators had only a few records in the iNaturalist database. Therefore, the analysis was performed not by individual species, but by pooling all the data in the 3 families of butterflies, all the dragon and damselflies, and all the bumblebees.
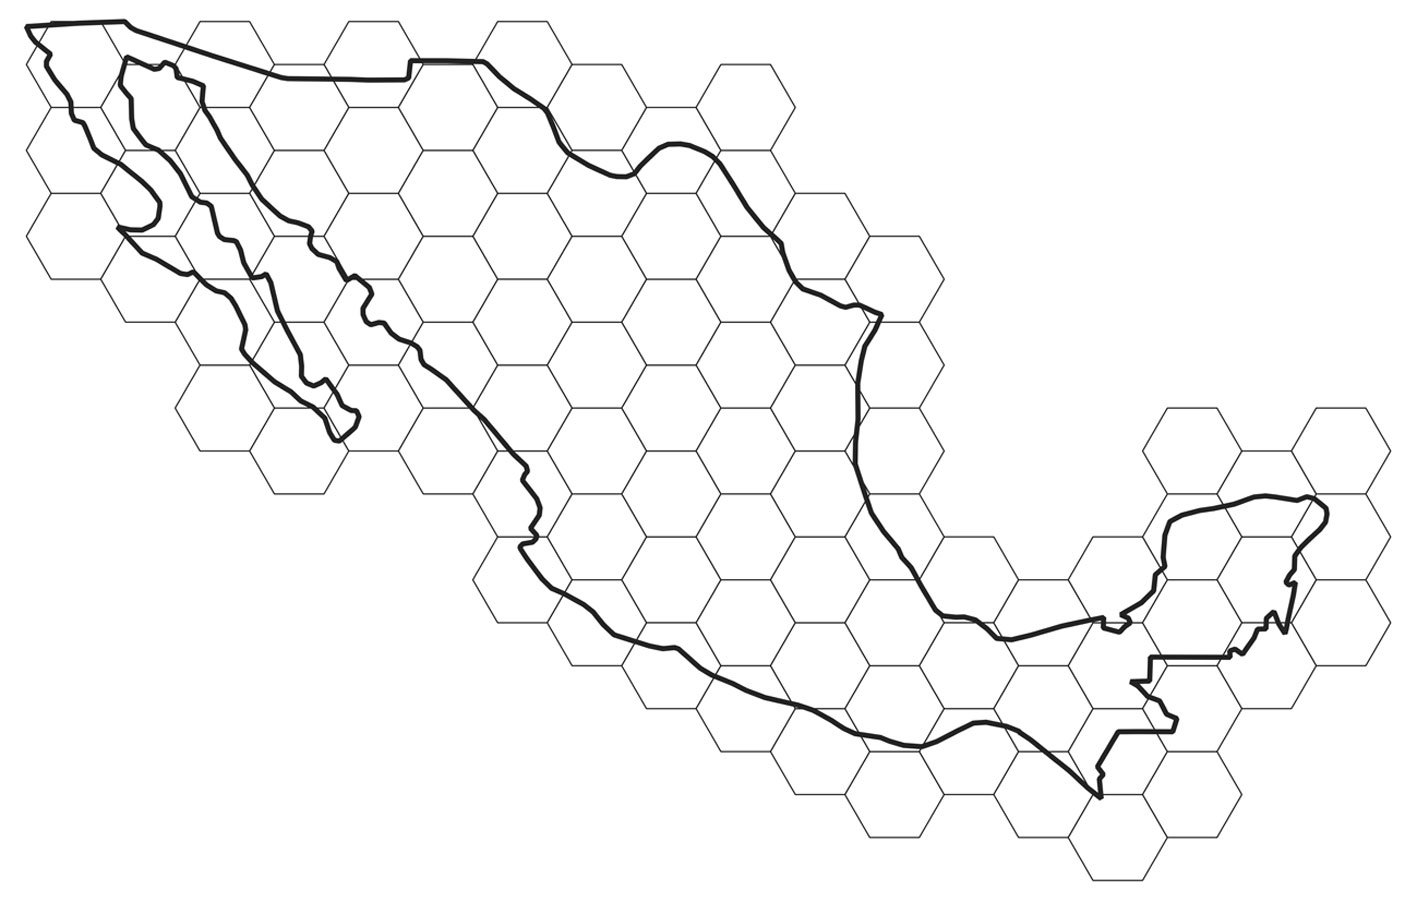
For obtaining uncertainty bands, grids of hexagons covering the territory of Mexico were defined at several resolutions (Fig. 1). For a given year and taxonomic group, the means and variances over hexagons were determined. Each unique combination of year and hexagon defined an “event,” and thus the abundance metrics were: 1) the number of observations per event (cumulative monthly observations); and 2) the number of different species per event. As a measure of effort, the total number of different observers with at least 2 observations in each “event” was used. The final index was the average over all hexagons with at least 1 record, for a given year, of the number of observations or the number of species, per observer.
Table 1
Numbers of scientific names for the different taxonomic groups in the 4 most visited potential vegetation classes. The butterflies are the Papilionidae (swallowtails), Pieridae (sulfurs), and Nymphalidae (brushfoots).
| All Mexico | Xerophytic Shrub | Pine Oak Forest | Grasslands | Tropical Deciduous Forest | |
| Butterflies | 413 | 153 | 220 | 220 | 198 |
| Odonata | 292 | 185 | 187 | 105 | 184 |
| Bombus | 23 | 16 | 20 | 9 | 14 |
| Solanaceae | 307 | 176 | 210 | 111 | 153 |
Changing the hexagon area might potentially change the results. This problem, described as the “modifiable areal unit problem,” has been long known to geographers (Openshaw, 1984). Fortunately, in this case, the qualitative results were not affected by the resolution of the hexagons (data correlations among resolutions always exceeded 0.7). Consequently, only the analysis using the largest (2 degrees) hexagons (n = 81) is reported.
The literature has suggested that the decrease in insect abundance has been due to: 1) increased use of pesticides, 2) decreased habitat area (or increased transformed land area), and 3) climate change. At the scale of the whole country, regressions of data versus time series of pesticide use and deforestation rates are reported.
Materials and methods
CS data are not ideally suited to the estimation of trends, primarily because of the biased and uneven methods of sampling sites, times, and species. This work used 1 of the 3 methods proposed by Isaac et al. (2014): correcting the reported number of sightings according to a measure of effort. iNaturalist data were downloaded from the Global Biodiversity Information Network (GBIF), as detailed in Table 2.
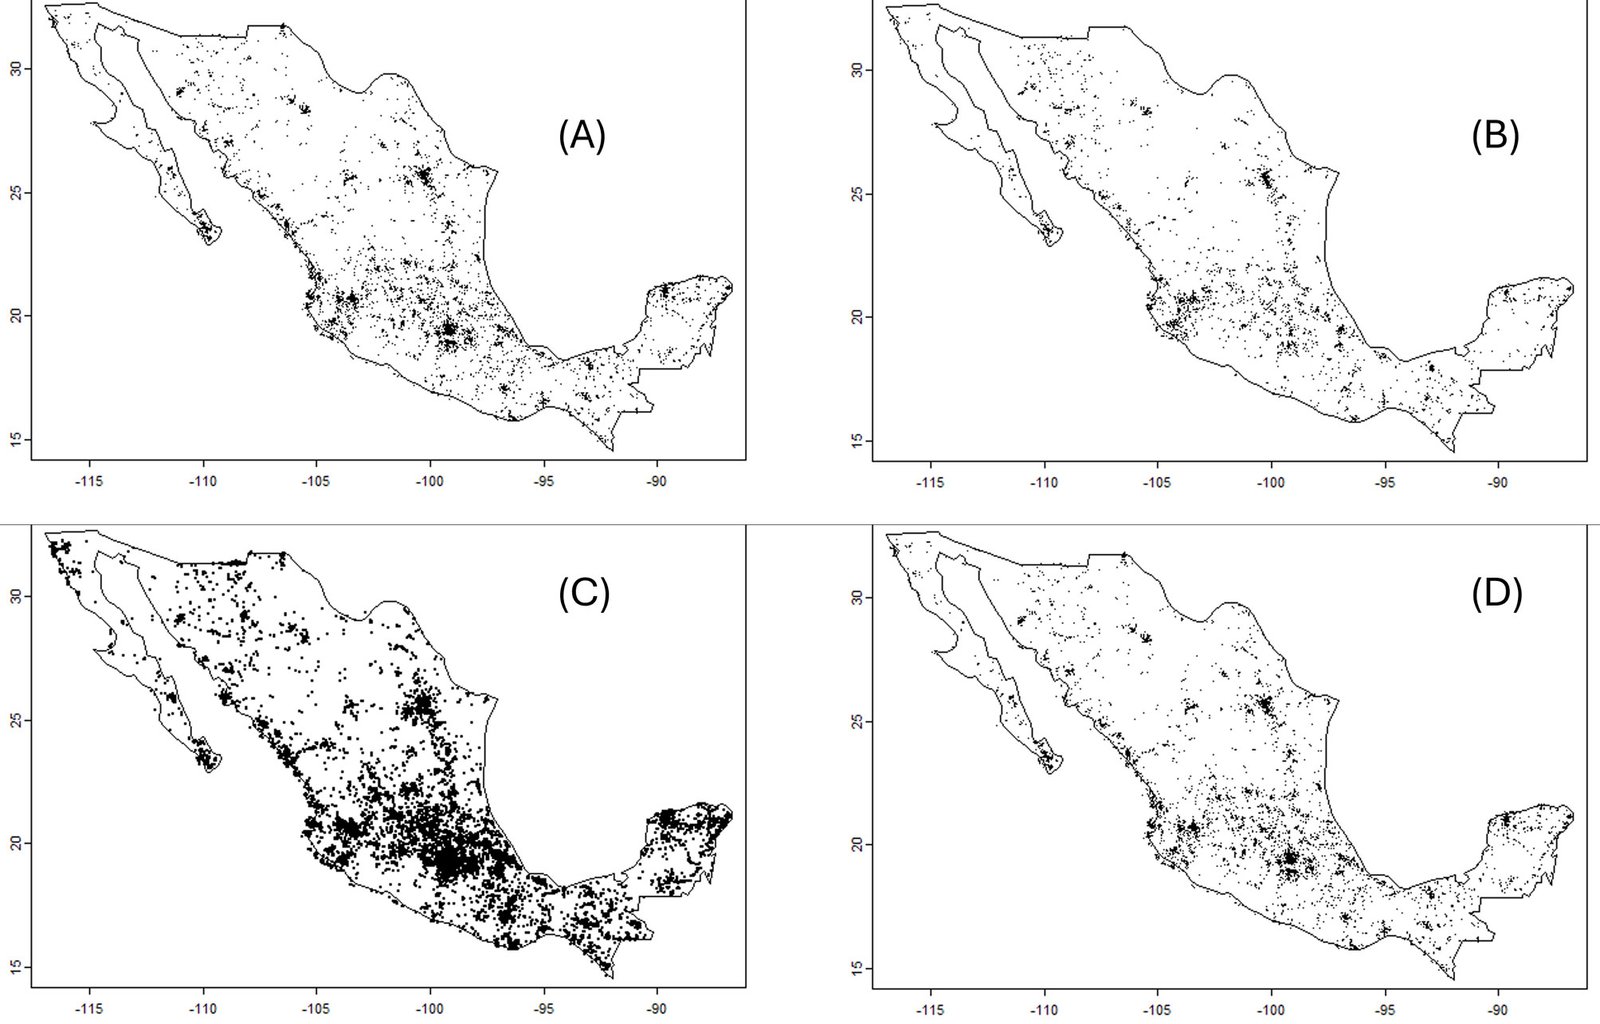
Data were divided into subsets (keeping records with coordinates) for the 4 largest families in the Papilionoidea: Papilionidae (5,583 records), Pieridae (29,994 records), Nymphalidae (20,145 records), and Lycaenidae (2,326 records). The Lycaenidae was removed from the analysis because many species are relatively difficult to determine visually. Data for the genus Bombus (bumblebees, 6,543 records) and the 2 suborders of the Odonata (the Zygoptera, 12,772 records, and the Anisoptera, 24,003 records) were also downloaded. For comparison purposes, observations of the nightshade family, the Solanaceae (39,014 records), were downloaded. The number and positions of every observation in Mexico are presented in figure 2.
Table 2
Digital Object Identifiers (DOIs) from GBIF for the datasets used in the work.
| Taxon | GBIF DOI | iNaturalist Records | Unique names |
| Nymphalidae | doi.org/10.15468/dl.qta4zp | 20,145 | 223 |
| Papilionidae | doi.org/10.15468/dl.uu4unc | 5,583 | 13 |
| Pieridae | doi.org/10.15468/dl.zug4ee | 29,994 | 80 |
| Lycaenidae | doi.org/10.15468/dl.xgad6g | 2,326 | 97 |
| Odonata | doi.org/10.15468/dl.atdkfz | 36,775 | 292 |
| Anisoptera | 24,003 | 163 | |
| Zygoptera | 12,772 | 129 | |
| Bombus | doi.org/10.15468/dl.c6h4jz | 6,543 | 23 |
| Solanaceae | doi.org/10.15468/dl.597nj5 | 39,014 | 307 |
Data tagged as “research quality” in the downloaded GBIF data were retained, and basic data cleaning was performed to keep the coordinates inside Mexico. No attempt was made to correct for outdated taxonomy or other known issues present in aggregator data (Chapman, 2005).
Data can be organized as time series, by pooling the observations in a year. This method has a drawback of potentially missing seasonality; however, pooling by month produces tables that are too sparse and therefore are difficult to analyze. To include some measure of uncertainty in the trends, the averages of the calculated indices over all non-empty (i.e., with at least 1 observation) hexagons of 2 degrees of surface were determined, and its standard error calculated.
Two indices were used: different_species/observer and records/observer. The first is a measure of diversity, whereas the second is a measure of abundance. Findings for both are reported. “Observers” refers to the number of observers with at least 2 registered observations.
To summarize trends, a useful statistic may be the slope of a linear model of index as a function of time, which requires regressions of index vs. year. However, as previously discussed, the errors in many time series are not independent, and the equal variance assumption of ordinary least squares is also often violated. If uncorrec-
ted, these problems interfere with rigorous calculations of probability under a null hypothesis (McShane et al., 2019). Among the many methods for addressing this problem, generalized least squares regressions (Baillie & Kim, 2018), which enable inclusion of an autoregressive structure of correlations and violations of homoscedasticity, were chosen herein. Two models were fitted to the data: an ordinary linear least squares, and a first order auto-regressive, moving average model (ARIMA) (Shumway & Stoffer, 2005) allowing for heteroskedasticity. The 2 models were compared with an ANOVA (Fox & Weisberg, 2019), and the most likely model (based on the Akaike criterion; see Fox & Weisberg, 2019) was used. This process permitted to obtain, in a rigorous way, the probability for the observed slope values, under a null hypothesis of a slope equal to zero. Reporting the “significance” of slopes has been substantially criticized (McShane et al., 2019). Therefore, the probability (rather than the “significance”) of the slope, based on the assumption of a null model of no trend, is reported. Very small probabilities are highlighted.
The regressions included 2 possible causal factors: forest loss and use of pesticides. The deforestation rate was obtained from the Global Forest Watch website (Sims et al., 2024) with a threshold of 30% of forest cover, as recommended by Sims et al. (2024). This dataset has maintained methodological consistency (Hansen et al., 2013) and therefore is preferable to the INEGI Series (Gebhardt et al., 2015). Agrochemical use was determined as the amount of pesticides used per hectare of cropland, as reported on the FAO Web site. The data came from government reports https://www.fao.org/faostat/en/#data/RP. A discussion of the FAO dataset’s strengths and problems has been provided by Shattuck et al. (2023).
Because the probability of the observed values of the slope of the index of diversity per unit of effort vs. time, under a null hypothesis of 0 slope, was small in most cases, the regression was assumed to remove the time trend, and factors affecting just the residuals were searched for. That is, the residual of the index vs. time regressions was regressed against 2 predictors: deforestation rate and use of pesticides. The results are shown in the Supplementary materials.
To aggregate by “biome,” the subdivision of the Potential Vegetation of Mexico (Rzedowsky, 1986) was selected. A shapefile of Rzedowsky’s map at 1:4,000,000 scale, available at Conabio Geoportal, is produced by Instituto de Geografía, UNAM México. This map was used to pool the iNaturalist records according to potential vegetation, by using the 4 categories with the highest number of iNaturalist reports.
An informal survey was circulated among scientists working in 3 major ecology research centers in Mexico (INECOL, Veracruz, Instituto de Ecología, UNAM, and Ecosur, Chiapas). A total of 37 questionnaires were sent with Qualtrics. The questions are provided in the Supplementary materials. The main data tables and R code are openly available (Creative Commons CC0: 1) at https://github.com/jsoberon/iNaturalistInsectsMexico
Results
The informal questionnaire received 27 responses out of 37 requests. Among the respondents, 84% stated that they have observed a decrease in the number of insects either in streetlights in villages, or in the windshields or radiators of field vehicles. Although these answers lacked statistical rigor, they suggested a widespread perception among field biologists in Mexico that insect populations are becoming smaller.
The iNaturalist data provided a more nuanced picture. Before examining the trends in biodiversity indices, basic data were analyzed. Indeed, both the number of species and the number of observers (with more than 2 observations) increased (Fig. 3).
The numbers of observed species and observers both increase over time. The increased number of observers introduced an important bias in the data, given that more species (or more individuals) would reasonably be expected to be reported if more observers were present. However, although the diversity of insects appeared to be decreasing, the evidence of a decrease in abundance was unclear (Fig. 4; Tables 3, 4).
Diversity per unit effort appeared to decrease (Table 3). However, the trends in the abundance (observations/number observers) were either positive or indistinguishable from 0 (Table 4). Box plots of the slopes of the regressions for the 2 indices (species, and observations) are shown in figure 5.
The above results suggest that diversity is decreasing, but abundance is stable. This finding is inconsistent with the informal perceptions of field biologists (as indicated by the questionnaire), most of whom perceived diminished insect abundance. Among the few insect species whose abundance in Mexico has been monitored systematically, Danaus plexippus (monarch butterfly) populations are decreasing (Vidal & Rendón-Salinas, 2014; Zylstra et al., 2021), whereas Anastrepha fruit fly populations appear to be stable (Aluja et al., 2012; Ordano et al., 2013). Comparing these 2 cases is challenging, because monarch butterflies are affected by a variety of factors occurring on a continental scale, whereas fruit flies might be affected primarily by local factors.
Might the negative trend in diversity correlate with predictors often associated with insect loss? Forest cover, as measured via remote sensing over 15 years (Hansen et al., 2013), is decreasing in Mexico (Supplementary materials). Pesticide use per hectare of crop, as reported by the FAO, increased until 2018, when the FAO database indicated an abrupt decrease (Supplementary materials). The causes of this decrease, if real, are unknown; however, after the COVID-19 pandemic, Mexico’s primary sector experienced a marked decrease in activity (Sánchez et al., 2022), which may explain a drop in the use of agrochemicals. Regressions of the residuals of the diversity/effort vs. time models against 2 predictors, deforestation rate and pesticide use per hectare, were not associated with small probabilities of an H0 of 0 slope (Supplementary materials). Consequently, the data did not provide evidence that negative slopes in insect diversity were due to pesticide use or deforestation.
Finally, for the major taxonomic groups, the slopes of the generalized least squares, in the first 4 potential vegetation types according to Rzedowsky (1986) were most negative for bumblebees in tropical deciduous forest, followed by pine-oak forest and xerophytic shrub. For the butterflies, the most negative slope was in pine-oak forest, followed by tropical deciduous forest and xerophytic shrub (Supplementary materials: Table S3). In the case of the Solanaceae, a group included for comparison purposes, the slope is only negative in the grasslands vegetation type.


Table 3
Regression analysis (generalized least squares) of diversity/observer vs. time in the iNaturalist data, for the main taxonomic groups. The analysis was performed over the mean values in hexagons of 2 degrees of resolution. With the exception of the Zygoptera, for which the first order autoregressive model did not converge, the ordinary least squares regression did not significantly differ with respect to models with autocovariance and heteroskedasticity. Consequently, the table shows the slope of ordinary linear models of different_species/effort with respect to time. The probabilities of the obtained values under a null hypothesis of slope of zero were very small, with the exception of the dragonflies and swallowtails (Fig. 2).
| Taxon | Species, 2 degrees | |||
| Slope | p | Model | n | |
| Bombus | -0.0428 | 0.0000237 | OLS | 6,543 |
| Anisoptera | -0.0206 | 0.00155 | OLS | 24,003 |
| Zygoptera | 0.0003 | 0.942 | OLS_NO_CNV | 12,772 |
| Nymphalidae | -0.0372 | 0.000000242 | OLS | 20,145 |
| Papilionidae | -0.0108 | 0.104 | OLS | 5,583 |
| Pieridae | -0.0247 | 0.000202 | OLS | 29,994 |
Table 4
Regression analysis (generalized least squares) of records/observer vs. time in the iNaturalist data, for the main taxonomic groups. The data were averaged over hexagons of 2 degrees of resolution. Except for the Zygoptera, for which a first order autoregressive model was used, the ordinary least squares regression did not significantly differ with respect to models with autocovariance and heteroskedasticity. Consequently, the table shows the slope of ordinary linear regressions of number_of_records/effort with respect to time. Notably, every regression had a positive, low probability slope.
| Taxon | Slope | p | Model | n |
| Bombus | 0.0446 | 0.00000766 | OLS | 6,543 |
| Anisoptera | 0.0201 | 0.00649 | OLS | 24,003 |
| Zygoptera | 0.0366 | 6.86E-08 | ARIMA | 12,772 |
| Nymphalidae | 0.0089 | 0.034 | OLS | 20,145 |
| Papilionidae | 0.0669 | 0.00000176 | OLS | 5,583 |
| Pieridae | 0.0154 | 0.0000984 | OLS | 29,994 |

Discussion
The results show a tendency to decrease the number of species with time, for the insects, and a much less marked negative trend for the Solanaceae. This suggests that CS data does capture some sort of biological signal in the data. However, a diminishing trend of diversity, together with a stable pattern of abundance, are compatible with several hypotheses. One entirely biological hypothesis is that insect diversity, but not abundance, is decreasing. If the rarest species are disappearing, then the country is homogenizing (McKinney & Lockwood, 1999). Thus, Mexico’s highly diverse and unique insect biodiversity is slowly being replaced by a more homogeneous, more cosmopolitan set of species. This rather alarming possibility, supported by the CS data, must be more directly assessed in the field.
Another explanation for the observed negative trend in insect species numbers might be that, over time, observers have reached the asymptote of the total number of species available to be observed. Since the total number of species in any given area is probably roughly constant, with sufficient effort, no more than that constant number can be reported; however, if the number of observers is increasing, a negative trend in the index of species/observers would result. The total number of species in the database, for each taxonomic group, is shown in Table 1. The average number of species reported per hexagon was well below that total (Supplementary materials: Table S4), thus suggesting that a saturation effect was not present, and the results presented here indeed indicate a decreasing trend in insect diversity. This complex point is discussed at more length in the Supplementary materials.
Finally, the negative trend is also compatible with a hypothesis regarding the quality of iNaturalist observers in which the number of observers has increased, as indicated by the data, whereas the observers’ discrimination ability or interests might have changed over time, perhaps because they focused on common species. Unfortunately, the very nature of the information in CS data makes assessing this effect very difficult. This aspect essentially describes the main problem with using unstructured CS data: because the methods are not standardized, any trend in the data might be explained by a trend in the behavior of the observers.
What explanations can be deduced for the absence of trends in the number of observations/effort? One possibility is that the presence of more observers simply resulted in more observations, and the number of observations and observers with more than 2 observations are roughly proportional. This means that the lack of trend could be an artifact of the data.
These results should be considered as hypotheses to be examined through more direct methods. Nonetheless, the results strongly suggest decreasing numbers of species in butterflies (important from a cultural perspective and perhaps a pollination perspective), bumblebees (important as pollinators), and Odonata (important as insect predators and as indicators). Therefore, the biodiversity of some of the most important and underappreciated groups of species in Mexico appears to be decreasing. If confirmed, this result would be highly alarming. Indeed, insects are key components of ecosystems (Noriega et al., 2018). Although for most insect species in Mexico we do not have direct documentation of their role, or of the economic and cultural value of their services, we have substantial indirect evidence of their importance as pollinators (Ashworth et al., 2009), as natural enemies of agricultural pests (López et al., 1999; Aluja et al., 2014), and as potential for non-conventional agri-business (López-Gutierrez et al., 2023). If substantiated, the decrease we report should be a major cause of alarm for Mexicans.
What might be causing a decrease? In a study in Europe (Schuch et al., 2012), in which a similar decrease in diversity was reported in a family of bugs of agricultural importance, a concomitant loss of non-agricultural habitat for the insects was reported. The study was conducted at the species level, and the authors argue that the more specialized, less tolerant species are those disappearing because of agricultural expansion. Again, monitoring using standardized procedures is required to test this idea.
Climate change is often cited as a cause of population decline in insects. However, climate change is a long-term phenomenon that occurs at the scale of many decades. To demonstrate climate change as a factor affecting population size, modeling or documentation of the effect of mean and variance in climatic variables on long-term population time series is necessary (Batalden et al., 2014; Boggs, 2016). The data used in this work is not appropriate for this purpose.
The results suggested that negative trends might not be identical among ecological regions. However, interestingly, the iNaturalist data indicated that pine-oak forest, xeric shrub, and tropical deciduous forest might be hotspots of diversity loss. This finding is somewhat surprising, given the widespread concern regarding tropical rainforests. Of course, the results may be due to the scarcity of data for tropical wet vegetation types.
CS data exists in substantial and growing amounts. It is a very valuable source of data. However, as with any data, it contains biases that are sometimes difficult to remove. The unavoidable conclusion is that Mexico must crucially invest in countrywide insect monitoring schemes based on systematic methods. Several approaches could be used. The first is improving CS schemes, providing training, and applying standard protocols, as performed in Canada, the USA, and many European countries (Streiter et al., 2024). This approach might be useful only for conspicuous, easily identifiable species, yet it markedly influences public environmental awareness and therefore should be maintained (Dickinson et al., 2012). Several methods using advanced technologies include computer vision, bioacoustics, and metagenomics can also be used (Van Klink et al., 2022). For bats, monitoring is already underway in Mexico (Zamora-Gutiérrez et al., 2020). Adoption of high technology methods would require funding, training, and substantial analytical capacity.
Regardless of the method chosen, in Mexico, the fourth most biologically diverse country on the planet, monitoring as many biodiversity components as possible is critical, and insects, “the little things that run the world” in the words of E. O. Wilson, appear to be disappearing very rapidly. Societies need to pay attention.
Acknowledgements
I am very grateful to Luis Eguiarte and Rodrigo Medellín, of the Mexican Instituto de Ecología, for their detailed and positive criticism of the methods I used. Their feedback led to several changes in the data analysis methods. Exequiel Ezcurra, of the University of California at Irvine, and Carlos Martinez, formerly of the University of Wyoming, also made very helpful statistical suggestions. My students Jennifer Ramos and Anahí Quezada helped me download and organize the data and patiently discussed the project with me. I gratefully thank the field ecologists in Mexico who took the time to respond to the questionnaire regarding their experiences with insects in the field.
References
Almond, R. E., Grooten, M., & Peterson, T. (2020). Living planet report 2020-Bending the curve of biodiversity loss. Gland, Switzerland: World Wildlife Fund.
Aluja, M., Ordano, M., Guillén, L., & Rull, J. (2012). Understanding long-term fruit fly (Diptera: Tephritidae) population dynamics: implications for areawide manage-
ment. Journal of Economic Entomology, 105, 823–836. https://doi.org/dx.doi.org/10.1603/EC11353
Aluja, M., Sivinski, J., Van Driesche, R., Anzures-Dadda, A., & Guillén, L. (2014). Pest management through tropical tree conservation. Biodiversity and Conservation, 23, 831–853. https://doi.org/10.1007/s10531-014-0636-3
Anonymous. (1997). Ecological regions of North America. Towards a common perspective. Montreal: Comisión de Cooperación Ambiental de América del Norte.
Ashworth, L., Quesada, M., Casas, A., Aguilar, R., & Oyama, K. (2009). Pollinator-dependent food production in Mexico. Biological Conservation, 142, 1050–1057. https://doi.org/10.1016/j.biocon.2009.01.016
Ayala, R., González, V. H., & Engel, M. S. (2012). Mexican stingless bees (Hymenoptera: Apidae): diversity, distribution, and indigenous knowledge. Pot-honey: a legacy of stingless bees. New York: Springer. https://doi.org/10.1007/978-1-4614-4960-7_9
Baillie, R. T., & Kim, K. H. (2018). Choices between OLS with robust inference and feasible GLS in time series regressions. Economics Letters, 171, 218–221. https://doi.org/10.1016/j.econlet.2018.07.036
Basset, Y., Lamarre, G. P., Ratz, T., Segar, S. T., Decaëns, T., Rougerie, R. et al. (2017). The Saturniidae of Barro Colorado Island, Panama: a model taxon for studying the long-term effects of climate change? Ecology and Evolution, 7, 9991–10004. https:// doi.org/10.1002/ece3.3515
Batalden, R. V., Oberhauser, K., & Peterson, A. T. (2014). Ecological niches in sequential generations of eastern North American Monarch butterflies (Lepidoptera: Danaidae): the ecology of migration and likely climate change implications. Environmental Entomology, 36, 1365–1373. https://doi.org/10.1603/0046-225x(2007)36[1365:enisgo]2.0.co;2
Beutelspacher, C. R. (1989). Las mariposas entre los antiguos mexicanos. Mexico D.F.: Fondo de Cultura Económica.
Boggs, C. L. (2016). The fingerprints of global climate change on insect populations. Current Opinion in Insect Science, 17, 69–73. https://doi.org/10.1016/j.cois.2016.07.004
Bonadies, E., Lamarre, G. P., Souto-Vilarós, D., Pardikes, N. A., Silva, J. A. R., Perez, F. et al. (2024). Population trends of insect pollinators in a species-rich tropical rainforest: stable trends but contrasting patterns across taxa. Biology Letters, 20, 20240170. https://doi.org/10.1098/rsbl.2024.0170
Boyle, M. J., Bonebrake, T. C., Dias da Silva, K., Dongmo, M. A., Machado-França, F., Gregory, N. et al. (2025). Causes and consequences of insect decline in tropical forests. Nature Reviews Biodiversity, 1, 315–331. https://doi.org/10.1038/s44358-025-00038-9
Challenger, A., & Soberón, J. (2012). Los ecosistemas terrestres, en Capital natural de México. Conocimiento Actual de la Biodiversidad. México D.F.: Conabio.
Chapman, A. (2005). Principles and methods of data cleaning-primary species and species-occurrence data. Copenhagen: Global Biodiversity Information Facility.
Cohn, J. P. (2008). Citizen science: Can volunteers do real research? Bioscience, 58, 192–197. https://doi.org/10.1641/B580303
Crall, A. W., Newman, G. J., Stohlgren, T. J., Holfelder, K. A., Graham, J., & Waller, D. M. (2011). Assessing citizen science data quality: an invasive species case study. Conservation Letters, 4, 433–442. https:// doi.org/10.1111/j.1755-263X.2011.00196.x
Di Cecco, G. J., Barve, V., Belitz, M. W., Stucky, B. J., Guralnick, R. P., & Hurlbert, A. H. (2021). Observing the observers: How participants contribute data to iNaturalist and implications for biodiversity science. Bioscience, 71, 1179–1188. https://doi.org/10.1093/biosci/biab093
Dickinson, J. L., Shirk, J., Bonter, D., Bonney, R., Crain, R. L., Martin, J. et al. (2012). The current state of citizen science as a tool for ecological research and public engagement. Frontiers in Ecology and the Environment, 10, 291–297. https://doi.org/10.1093/biosci/biab093
Duffus, N. E., Christie, C. R., & Morimoto, J. (2021). Insect cultural services: how insects have changed our lives and how can we do better for them. Insects, 12, 377. https://doi.org/10.3390/insects12050377
Edwards, C. B., Zipkin, E. F., Henry, E. H., Haddad, N. M., Forister, M. L., Burls, K. J. et al. (2025). Rapid butterfly declines across the United States during the 21st century. Science, 387, 1090–1094. https://doi.org/10.1126/science.adp4671
Fox, J., & Weisberg, S. (2019). Nonlinear regression, nonlinear least squares, and nonlinear mixed models in R. In J. Fox, & Weisberg, S. (Eds.), An R companion to applied regression, 3rd Ed. (pp. 1–31). Los Angeles: Sage Publications.
Gebhardt, S., Maeda, P., Wehrmann, T., Argumedo-Espinoza, J., & Schmidt, M. (2015). A proper land cover and forest type classification scheme for Mexico. The International Archives of the Photogrammetry, Remote Sensing and Spatial Information Sciences, 40, 383–390. https://doi.org/10.5194/isprsarchives-XL-7-W3-383-2015
Gulland, J. A. (1969). Manual of methods for fish stock assessment. Part 1. Fish Population Analysis. Rome: Fishery Resources and Exploitation Division, FAO.
Hallmann, C. A., Sorg, M., Jongejans, E., Siepel, H., Hofland, N., Schwan, H. et al. (2017). More than 75 percent decline over 27 years in total flying insect biomass in protected areas. Plos One, 12, e0185809. https://doi.org/10.1371/journal.pone.0185809
Hansen, M. C., Potapov, P. V., Moore, R., Hancher, M., Turubanova, S. A., Tyukavina, A., D. et al. (2013). High-resolution global maps of 21st-century forest cover change. Science, 342, 850–853. https://doi.org/ 10.1126/science.1244693
Isaac, N. J., van Strien, A. J., August, T. A., de Zeeuw, M. P., & Roy, D. B. (2014). Statistics for citizen science: extracting signals of change from noisy ecological data. Methods in Ecology and Evolution, 5, 1052–1060. https://doi.org/10.1111/2041-210X.12254
Lister, B. C., & García, A. (2018). Climate-driven declines in arthropod abundance restructure a rainforest food web. Proceedings of the National Academy of Sciences, 115, E10397–E10406. https://doi.org/10.1073/pnas.1722477115
López-Gutiérrez, S., Pozo, C., Muñoz, D. E. R., & Baltazar, E. B. (2023). The live butterfly trade as bio-business in southern Mexico. Journal of Rural and Community Development, 18, 131–152.
López, M., Aluja, M., & Sivinski, J. (1999). Hymenopterous larval–pupal and pupal parasitoids of Anastrepha flies (Diptera: Tephritidae) in Mexico. Biological Control, 15, 119–129. https://doi.org/10.1006/bcon.1999.0711
Lucas, M., Forero, D., & Basset, Y. (2016). Diversity and recent population trends of assassin bugs (Hemiptera: Reduviidae) on Barro Colorado Island, Panama. Insect Conservation and Diversity, 9, 546–558. https://doi.org/10.1111/icad.12191
Lyubchich, V., Gel, Y. R., & El-Shaarawi, A. (2013). On detecting non-monotonic trends in environmental time series: A fusion of local regression and bootstrap. Environmetrics, 24, 209–226. https://doi.org/ 10.1002/env.2212
Macías, C. G. V., & Freire, L. R. (2017). Plataforma Naturalista en México: herramienta de ciencia ciudadana. Índice, 12, 762.
Mason, B. M., Mesaglio, T., Barratt-Heitmann, J., Chandler, M., Chowdhury, S., Gorta, S. B. Z. et al. (2025). iNaturalist accelerates biodiversity research. Bioscience, 2025, biaf104. https://doi.org/10.1093/biosci/biaf104
McKinney, M. L., & Lockwood, J. L. (1999). Biotic homogenization: a few winners replacing many losers in the next mass extinction. Trends in Ecology & Evolution, 14, 450–453. https://doi.org/10.1016/S0169-5347(99)01679-1
McShane, B. B., Gal, D., Gelman, A., Robert, C., & Tackett, J. L. (2019). Abandon statistical significance. The American Statistician, 73, 235–245. https://doi.org/10.1080/00031305.2018.1527253
Michán, L., & Llorente, J. (2002). Hacia una historia de la Entomología en México. Publicaciones Especiales del Museo de Zoologia, UNAM, Mexico, 3, 3–52.
Miranda, F., & Hernández, E. (1963). Los tipos de vegetación de México y su clasificación. Botanical Sciences, 215, 29–179. https://doi.org/10.17129/botsci.1084
Mittermeier, R., Robles-Gil, P., & Mittermeier, C. (1997). Megadiversidad: los países biológicamente mas ricos del mundo. México D.F.: CEMEX.
NERC Centre for Population Biology, I. C. (1999). The global population dynamics database. https://knb.ecoinformatics.org/view/doi%3A10.5063%2FAA%2Fnceas.167.1
Noriega, J. A., Hortal, J., Azcárate, F. M., Berg, M. P., Bonada, N., Briones, M. J. et al. (2018). Research trends in ecosystem services provided by insects. Basic and Applied Ecology, 26, 8–23. https://doi.org/10.1016/j.baae.2017.09.006
Novoyny, V., & Basset, Y. (2000). Rare species in communities of tropical insect herbivores: pondering the mystery of singletons. Oikos, 89, 564. https://doi.org/10.1034/j.1600-0706.2000.890316.x
Olson, D. M., Wikramanayake, E. D., Burges, N. D., Powell, G. V. N., Underwood, E. C., D’Amico, J. A. et al. (2001). Terrestrial ecorregions of the world: a new map of life on earth. Bioscience, 51, 933. https://doi.org/10.1641/0006-3568(2001)051[0933:TEOTWA]2.0.CO;2
Openshaw, S. (1984). The modifiable areal unit problem. Norwich: Geo Books.
Ordano, M., Guillén, L., Rull, J., Lasa, R., & Aluja, M. (2013). Temporal dynamics of diversity in a tropical fruit fly (Tephritidae) ensemble and their implications on pest management and biodiversity conservation. Biodiversity and Conservation, 22, 1557–1575. https://doi.org/10.1007/s10531-013-0468-6
Orta, C., Reyes-Agüero, J. A., Luis-Martínez, M. A., Muñoz-Robles, C. A., & Méndez, H. (2022). Mariposas bioindicadoras ecológicas en México. Acta Zoológica Mexicana, 38, 1–33. https://doi.org/10.21829/azm.2022.3812488
Outhwaite, C. L. (2019). Modelling biodiversity trends from occurrence records. London: UCL (University College London).
Pannekoek, J., & van Strien, A. (1998). TRIM 2.0 for Windows (TRends and Indices for Monitoring Data).
Potts, S. G., Biesmeijer, J. C., Kremen, C., Neumann, P., Schweiger, O., & Kunin, W. E. (2010). Global pollinator declines: trends, impacts and drivers. Trends in Ecology & Evolution, 25, 345–353. https://doi.org/10.1016/j.tree.2010.01.007
Ramamoorthy, T. R., Bye, R., Lot, A., & Fa, J. (1993). Biological diversity of Mexico: origins and distribution. Oxford: Oxford University Press. https://doi.org/ 10.1007/bf02908211
Ramos-Elorduy, J., & Viejo-Montesinos, J. (2007). Los insectos como alimento humano: breve ensayo sobre la entomofagia, con especial referencia a México. Boletín de la Real Sociedad Española de Historia Natural Sección Biológica, 10, 61–84.
Rogel-Fajardo, I., Rojas-Lopez, A., & Ortega-Vega, S. Y. (2011). El turismo alternativo como estrategia de conservación de la reserva de la biosfera de la mariposa monarca (2008-2010). Quivera Revista de Estudios Territoriales, 13, 115–133.
Rzedowsky, J. (1986). Vegetación de México. México D.F.: Limusa.
Salcido, D. M., Forister, M. L., García-Lopez, H., & Dyer, L. A. (2020). Loss of dominant caterpillar genera in a protected tropical forest. Scientific Reports, 10, 422. https://doi.org/10.1038/s41598-019-57226-9
Sánchez-Herrera, M., Forero, D., Calor, A. R., Romero, G. Q., Riyaz, M., Callisto, M. F. et al. (2024). Systematic challenges and opportunities in insect monitoring: a Global South perspective. Philosophical Transactions of the Royal Society B, 379, 20230102. https://doi.org/10.1098/rstb.2023.0102
Sánchez, M. V., Cicowiez, M., & Ortega, A. (2022). Prioritizing public investment in agriculture for post-COVID-19 recovery: a sectoral ranking for Mexico. Food Policy, 109, 102251. https://doi.org/10.1016/j.foodpol.2022.102251
Schuch, S., Bock, J., Krause, B., Wesche, K., & Schaefer, M. (2012). Long-term population trends in three grassland insect groups: a comparative analysis of 1951 and 2009. Journal of applied Entomology, 136, 321–331. https://doi.org/10.1111/j.1439-0418.2011.01645.x
Shumway, R. H., & Stoffer, D. S. (2005). Time series analysis and its applications (Springer texts in Statistics). Cham, Switzerland: Springer-Verlag.
Sims, M. J., Stanimirova, R., Raichuk, A., Neumann, M., Richter, J., Follett, F. et al. (2024). Global drivers of forest loss at 1 km resolution. Environmental Research Letters, 20, 074027. https://doi.org/10.1088/1748-9326/add606
Soroye, P., Ahmed, N., & Kerr, J. T. (2018). Opportunistic citizen science data transform understanding of species distributions, phenology, and diversity gradients for global change research. Global Change Biology, 24, 5281–5291. https://doi.org/10.1111/gcb.14358
Streitberger, M., Stuhldreher, G., Fartmann, T., Ackermann, W., Ludwig, H., Pütz, S. et al. (2024). The German insect monitoring scheme: establishment of a nationwide long-term recording of arthropods. Basic and Applied Ecology, 80, 81–91. https://doi.org/10.1016/j.baae.2024.08.004
Szabo, J. K., Vesk, P. A., Baxter, P. W., & Possingham, H. P. (2010). Regional avian species declines estimated from volunteer-collected long-term data using List Length Analysis. Ecological Applications, 20, 2157–2169. https://doi.org/10.1890/09-0877.1
Tang, B., Clark, J. S., & Gelfand, A. E. (2021). Modeling spatially biased citizen science effort through the eBird database. Environmental and Ecological Statistics, 28, 609–630. https://doi.org/10.1007/s10651-021-00508-1
Thogmartin, W. E., Diffendorfer, J. E., López-Hoffman, L., Oberhauser, K., Pleasants, J., Semmens, B. X. et al. (2017). Density estimates of monarch butterflies overwintering in central Mexico. PeerJ, 5, e3221. https://doi.org/10.7717/peerj.3221
Thomas, J. (2005). Monitoring change in the abundance and distribution of insects using butterflies and other indicator groups. Philosophical Transactions of the Royal Society B: Biological Sciences, 360, 339–357. https://doi.org/10.2307/2265653
Van Klink, R., August, T., Bas, Y., Bodesheim, P., Bonn, A., Fossøy, F. et al. (2022). Emerging technologies revolutionise insect ecology and monitoring. Trends in Ecology & Evolution, 37, 872–885. https://doi.org/10.1016/j.tree.2022.06.001
van Strien, A. J., van Swaay, C. A., van Strien-van Liempt, W. T., Poot, M. J., & Wallis De Vries, M. F. (2019). Over a century of data reveal more than 80% decline in butterflies in the Netherlands. Biological Conservation, 234, 116–122. https://doi.org/10.1016/j.biocon.2019.03.023
Vidal, O., & Rendón-Salinas, E. (2014). Dynamics and trends of overwintering colonies ofthe monarch butterfly in Mexico. Biological Conservation, 180, 165–175. http://dx.doi.org/10.1016/j.biocon.2014.09.041
Wagner, D. L., Fox, R., Salcido, D. M., & Dyer, L. A. (2021). A window to the world of global insect declines: Moth biodiversity trends are complex and heterogeneous. Proceedings of the National Academy of Sciences, 118, e2002549117. https://doi.org/10.1073/pnas.2002549117
Willott, S. (2001). Species accumulation curves and the measure of sampling effort. Journal of Applied Ecology, 38, 484–486. https://doi.org/10.1046/j.1365-2664.2001.00589.x
Zamora-Gutiérrez, V., Ortega, J., Ávila-Flores, R., Aguilar-Rodríguez, P. A., Alarcón-Montano, M., Ávila-Torresagatón, L. G. et al. (2020). The Sonozotz project: assembling an echolocation call library for bats in a megadiverse country. Ecology & Evolution, 10, 4928–4943. https://doi.org/10.1002/ece3.6245
Zylstra, E. R., Ries, L., Neupane, N., Saunders, S. P., Ramírez, M. I., Rendón-Salinas, E. et al. (2021). Changes in climate drive recent monarch butterfly dynamics. Nature Ecology & Evolution, 5, 1441–1452. https://doi.org/10.1038/s41559-021-01504-1


