
Marina Simota-Ruiz a, Oscar Mikery b,Juan Cisneros a, Oscar Carmona-Castro a, Alfredo Castillo-Vera a, *, Alma E. García-Morales c
a El Colegio de la Frontera Sur, Ecología de Artrópodos y Manejo de Plagas, Carretera Antiguo Aeropuerto Km 2.5, 30700 Tapachula, Chiapas, Mexico
b Ortomolecular Mexicana BC, Grupo Molecular, Investigación, Calle Fray Justo Sierra No. 9216, Colonia Marrón, 22015 Tijuana, Baja California, Mexico
c El Colegio de la Frontera Sur, Departamento de Sistemática y Ecología Acuática, Avenida Centenario Km. 5.5, 77014 Chetumal, Quintana Roo, Mexico
*Corresponding author: acastill@ecosur.mx (A. Castillo-Vera)
Received: 28 February 2024; accepted: 14 February 2025
Abstract
The nematode Metaparasitylenchus hypothenemi (Poinar) (Tylenchida: Allantonematidae) is a parasite of the coffee berry borer (Hypothenemus hampei), one of the most significant pests affecting coffee crops. This study aimed to analyze the genetic variation of M. hypothenemi using the mitochondrial cytochrome oxidase subunit I (COI) gene. Reproductive females of M. hypothenemi were extracted from parasitized wild coffee berry borers for DNA extraction, amplification, and sequencing. Phylogenetic analyses revealed 2 well-differentiated lineages and 6 haplotypes distributed across 18 populations along a 100 km transect. Global genetic diversity was moderate (Hd = 0.52 ± 0.06), with a dominant haplotype present in 16 populations and others being representative or geographically isolated. Populations showed high genetic differentiation and restricted gene flow. These findings confirm the utility of the COI gene for analyzing the genetic variation of M. hypothenemi and provide a molecular basis for future studies on its biology and management.
Keywords: Obligate endoparasite; Insect pest; Genetic variation; COI Gene; Phylogenetic tree; Genetic structure
Variabilidad genética del nemátodo Metaparasitylenchus hypothenemi (Tylenchida:Allantonematidae), parásito natural de la broca del café (Coleoptera: Curculionidae: Scolytinae) usando secuencias de COI
Resumen
El nemátodo Metaparasitylenchus hypothenemi (Poinar) (Tylenchida: Allantonematidae) es un parásito de la broca del café (Hypothenemus hampei), una de las principales plagas del cultivo de café. Este estudio tuvo como objetivo analizar la variación genética de M. hypothenemi mediante el gen mitocondrial citocromo oxidasa subunidad I (COI). Se obtuvieron hembras reproductoras de M. hypothenemi de brocas silvestres parasitadas para la extracción, amplificación y secuenciación de DNA. Los análisis filogenéticos revelaron 2 linajes bien diferenciados y 6 haplotipos distribuidos en 18 poblaciones a lo largo de un transecto de 100 km. La diversidad genética global fue moderada (Hd = 0.52 ± 0.06), con un haplotipo dominante en 16 poblaciones y otros representativos o aislados geográficamente. Las poblaciones mostraron una alta diferenciación genética y flujo genético restringido. Estos resultados confirman la utilidad del gen COI para analizar la variación genética de M. hypothenemi y proporcionan bases moleculares para futuros estudios sobre su biología y manejo.
Palabras clave: Endoparásito obligado; Plaga de insectos; Variación genética; Gen COI; Árbol filogenético; Estructura genética
Introduction
The nematode, Metaparasitylenchus hypothenemi (Poinar) (Tylenchida: Allantonematidae), is an obligate endoparasite of the coffee berry borer (CBB), Hypo-
thenemus hampei (Ferrari) (Coleoptera: Curculionidae, Scolytinae), the most important insect pest of coffee worldwide (Le Pelley, 1968). Metaparasitylenchus hypothenemi was discovered in a commercial coffee plantation in southeastern Mexico attacking H. hampei adults (Castillo et al., 2002). M. hypothenemi reduce the fecundity and longevity of the females H. hampei (Castillo et al., 2019). This parasite-host relationship highlights the importance of studying its genetic variability and understanding its ecological role. The study of genetic variability in parasitic nematodes like M. hypothenemi requires molecular tools that enable precise population characterization. Among these, the mitochondrial gene cytochrome oxidase subunit I (COI) has proven to be an efficient marker for identifying specimens, clarifying evolutionary relationships among species, and analyzing population divergence (Hebert et al., 2003; Marsjan & Oldenbroek, 2007). This marker has been successfully used to analyze population structure and infer phylogenetic relationships in related nematodes, including parasites and entomopathogens such as Heterorhabditis marelatus and Deladenus proximus (Blouin et al., 1999; Fitza et al., 2019; Hartshorn et al., 2017; Saeb & David, 2014). However, there are few nematode sequences in both the BOLD Systems database and GenBank, and those corresponding to insect-parasitic nematodes are even scarcer, with M. hypothenemi being a species without previous genetic studies. The objective of this study was to analyze the genetic variability, in terms of the phylogeny, frequency of haplotypes and genetic differentiation between popula-
tions of the nematode Metaparasitylenchus hypothenemi collected from Soconusco, the only region in the world where this nematode has been systematically recorded.
Materials and methods
Five reproductive females of M. hypothenemi were collected in each of 18 localities from the Soconusco region, Chiapas, Mexico (Table 1, Fig. 1). Reproductive females of M. hypothenemi were extracted from the abdominal cavity of H. hampei, which were obtained from 100 coffee berries collected from coffee plants per locality. Reproductive females were selected for sampling due to their larger size compared to males, which facilitated DNA extraction and ensured the viability of the samples. Moreover, their genetic material plays a key role in transmitting genetic diversity to subsequent generations (Stewart & Larsson, 2014). The nematodes were stored in 2.5 ml microtubes containing 96% alcohol at -20 °C, until molecular analysis. The samples obtained in each sampled locality were considered as a population.
DNA extraction, amplification, and sequencing. A total of 90 nematodes of M. hypothenemi were used for DNA extraction. Total DNA from each specimen was extracted from the body complete of the nematode using a standard glass fiber method (Ivanova et al., 2006). A barcode region of approximately 658 base pairs (bp) of the mitochondrial COI gene was amplified using the primers ZplankF1_t1 (5’-TGTAAAACGACGGCCAGTTCTASWAATCATAARGATATTGG-3’) and ZplankR1_t1 (5’-CAGGAAACAGCTATGACTTCAGGRTGRCCRAARAATCA-3’) (Prosser et al., 2013). The final volume of the PCR mix was 12.5 µl, containing 0.12 µl of each primer (0.01 µM), 0.6 µl of MgCl2 (50 mM), 2 µl of ultrapure water, 0.06 µl of each dNTP (0.05 mM), 1.25 µl of 10X PCR buffer, 6.25 µl of trehalose 10%, 0.06 µl of Taq DNA polymerase (5U/µl) (Platinum® Taq, Invitrogen), and 3.5 µl of DNA template (Hajibabaei et al., 2005). The PCR amplification was carried out using the following conditions: 1 min at 94°C, followed by 5 cycles of 94˚C for 40 sec, 45˚C for 40 sec and 72˚C for 1 min, followed by 35 cycles of 94˚C for 40 sec, 51˚C for 40 sec and 72˚C for 1 min, with a final extension of 72˚C for 5 minutes. PCR products were checked for quality and length using electrophoresis on ethidium bromide stained, 2% agarose gels (E-Gel 96 Invitrogen, Carlsbad, CA) and were bidirectionally sequenced by Eurofins Genomics (USA). The sequences were edited using Codon Code Aligner v. 8.0.1 (Codon Code Corporation) and uploaded to both the Barcode of Life Data System (BOLD, www.boldsystems.org) and GenBank. In BOLD, they were labeled as Parasitic Nematode of coffee berry borer (PNBC), and in GenBank, they were assigned the accession numbers MT520707 to MT520790.
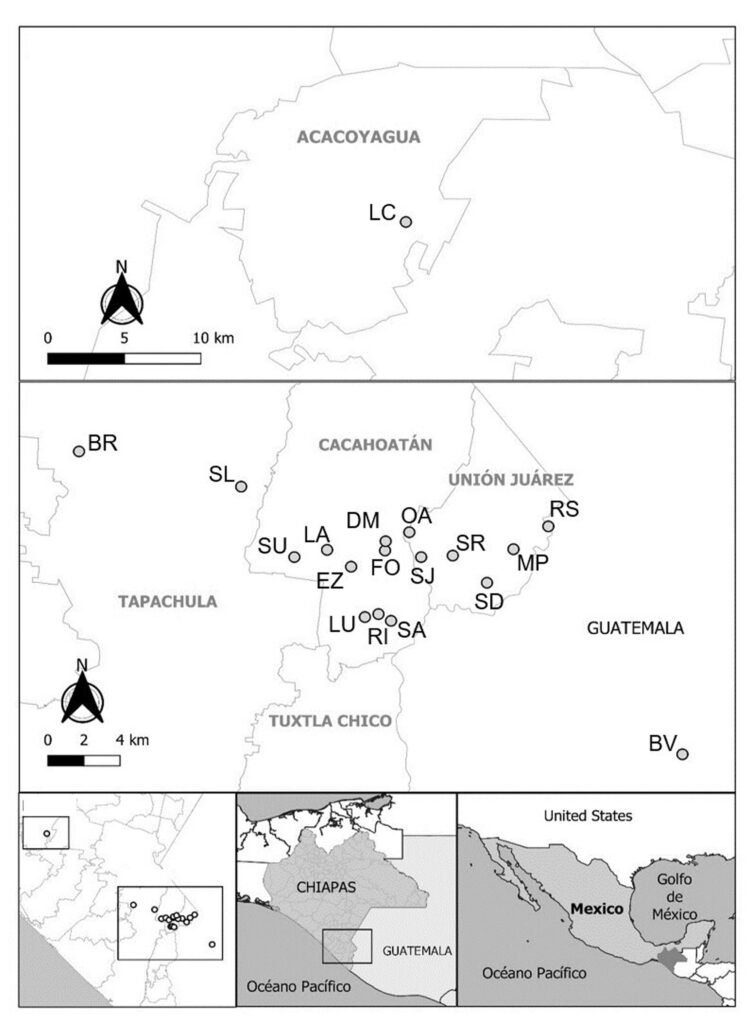
Figure 1. Geographic location of coffee plantations sampled to determine the presence of coffee berry borers infected with the nematode M. hypothenemi.
Genetic diversity and population structure. The sequences were aligned using the ClustalW algorithm in the MEGA X v. 7.0.26 (Kumar et al., 2018) software, optimizing global similarity to ensure accuracy in phylogenetic inferences. Genetic diversity was estimated by calculating the number of segregation sites (S), number of haplotypes (h), haplotype diversity (Hd), nucleotide diversity (Π) and average number of nucleotide differences (K) using the software DnaSP v. 6.12.03 (Rozas & Librado, 2009). To test the hypothesis of neutral evolution and to understand potential demographic events, such as expansion trends, Tajima’s D (Tajima, 1989) and Fu and Li’s D and F indices were estimated (Fu & Li, 1993). Genetic differentiation among populations was analyzed using the pairwise fixation index (FST). An analysis of molecular variance (AMOVA) was also performed to assess the statistical significance of FST values (Excoffier & Lischer, 2010). Two separate AMOVA analyses were conducted to determine whether genetic differentiation between these lineages was statistically significant: i) considering the populations as a panmictic group and ii) the populations were grouped based on the 2 phylogenetic lineages identified in the maximum likelihood tree. Furthermore, the number of migrants per generation (Nm), an indirect measure of gene flow between populations, was estimated. All analyses were performed using Arlequin v. 3.5 (Excoffier & Lischer, 2010). The relationship between genetic differences (FST) and geographic distances among populations was analyzed using the Mantel test (Mantel, 1967). Two matrices were compared: genetic differences between population pairs and geographic distances (in kilometers). Geographic distances were calculated using QGIS v3.10.3 software (https://qgis.org). These distances were used to perform a Mantel test to assess the potential relationship between genetic differentiation and geographic separation in the context of an isolation-by-distance pattern. The statistical analysis was conducted in R (R Core Team, 2020) using the Vegan package (Oksanen et al., 2010), with 1,000 permutations to assess significance.
Table 1
Geographical locations where CBB samples infected with M. hypothenemi were collected in Mexico and Guatemala.
| Municipality | Locality | Country | Code | Geographic coordinates | |
| Latitude | Longitude | ||||
| Tapachula | Santa Lucía | Mexico | SL | 15°04’42.5’’ | 92°13’42.5 |
| Finca Brasil | Mexico | BR | 15°05’50.3’’ | 92°18’43.1’’ | |
| Cacahoatán | Salvador Urbina | Mexico | SU | 15°02’26.9’’ | 92°12’03.9 |
| La Alianza | Mexico | LA | 15°02’40.8’’ | 92°11’03.2’’ | |
| El Zapote | Mexico | EZ | 15°02’08.4’’ | 92°10’18.7’’ | |
| La Unidad | Mexico | LU | 15°00’31.4’’ | 92°09’53.2 | |
| Dos de Mayo | Mexico | DM | 15°02’55.0’’ | 92°09’14.5’’ | |
| Faja de Oro | Mexico | FO | 15°02’56.4’’ | 92°09’14.4’’ | |
| Rosario Ixtal | Mexico | RI | 15°00’37.2’’ | 92°09’28.0’’ | |
| San Antonio | Mexico | SA | 15°00’24.2’’ | 92°09’04.7’’ | |
| Unión Juárez | Santo Domingo | Mexico | SD | 15°01’37.5’’ | 92°06’06.9’’ |
| San Rafael | Mexico | SR | 15°02’29.8’’ | 92°07’10.3’’ | |
| San Jerónimo | Mexico | SJ | 15°02’26.9’’ | 92°08’08.9’’ | |
| Monte Perla | Mexico | MP | 15°02’42.1’’ | 92°05’17.8’’ | |
| Río Suchiate | Mexico | RS | 15°03’26.1’’ | 92°04’13.2’’ | |
| Once de Abril | Mexico | OA | 15°03’14.8’ | 92°08’30.9’’ | |
| Acacoyagua | Los Cacaos | Mexico | LC | 15°23’23’’ | 92°39’13.0’’ |
| San Pablo | BuenaVista | Guatemala | BV | 14°57’53.1 | 91°59’48.7’’ |
The phylogeny of M. hypothenemi was inferred using RAxML v. 2.0. (Stamatakis, 2006). The General Time Reversible model with a proportion of invariant sites (GTR+I) was selected as the best approximation to the (TIM3+I) (-ln L 1,588.857; Delta-AIC = 0.0; AIC = 3,573.631) model obtained from the Akaike information criterion (AIC) (Akaike, 1974) analysis performed in JModelTest v. 0.1.1 (Posada, 2008). The analysis included 10,000 bootstrap replicates to ensure robust nodal support. Sequences of the nematode Howardula aoronymphium (Welch) (Tylenchida: Allantonematidae, GenBank: AY589466) was used as external group. The relationship between the identified haplotypes was analysed using a haplotype network generated in the PopART software v. 1.7 (Leigh & Bryant, 2015), applying the Median-Joining criterion.
Results
A total of 76 sequences of 560 bp from M. hypothenemi were analysed revealing 93 polymorphic sites (16.6%), whose A-T content (67.6%) was higher than the G-C content (32.4%). Global genetic diversity was moderate (Hd = 0.52 ± 0.06) (± SD) (Table 2). Ten populations presented zero diversity, while the SU and LC populations presented the highest genetic diversity from 18 populations (Table 2). The global neutrality tests were statistically significant according to Tajima values (D = -2.062, p < 0.05) and Fu and Li (D = 2.167, p < 0.02) (Table 2). Tajima and Fu and Li values were not significant inside of each population. A total of 6 haplotypes were identified, including one dominant haplotype (H1 = 50) and 4 unique ones (H3 = 2, H4 = 1, H5 = 5, and H6 = 1). The dominant haplotype was present in 16 from 18 populations sampled, while the second most common haplotype (H2 = 17) was recorded in 8 populations (Table 3).
High genetic differentiation was observed in M. hypothenemi, with a global value FST of 0.66 (p < 0.05) and a low number of migrants per generation (Nm = 0.50). The EZ, BR, and LC populations showed greater genetic differentiation than the rest of the populations, with an average distance between these and the other populations of 1.7-66.5 km, 9.5-50 km, and 50.5-87.5 km, respectively (Table 4). The smallest geographical distance was between the FO and DM populations (0.04 km), with no genetic differentiation between them. The AMOVA analysis conducted under panmictic indicate that genetic variation was greater between populations (66.61%) than within populations (33.39%). A second AMOVA, grouping populations according to the 2 phylogenetic lineages identified in the maximum likelihood tree, revealed a higher level of genetic differentiation between the lineages, with an FST of 0.99 (p < 0.01), indicating that the differentiation between the 2 lineages was statistically significant. In this second AMOVA, genetic variation was mainly distributed between lineages (99.42%) rather than within them (0.58%). The Mantel test revealed a significant correlation between the genetic pairwise distances and the geographic distances (km) among M. hypothenemi populations (r = 0.4728, p < 0.0001), consistent with a pattern of isolation by distance.
The tree topology revealed 2 independent clades with high support (> 90%). Clade I formed by 3 monophyletic groups, which corresponds to 96% of the specimens distributed in the municipalities of Tapachula, Cacahoatán, Unión Juárez, and San Pablo (Guatemala). Inside clade I, 2 subgroups were observed. The first subgroup had a bootstrap support value of 82%, while the second subgroup showed a higher support, with a bootstrap value of 99%. Clade II formed by 3 specimens belonging to the LC (Acacoyagua) population. A phylogenetic separation (16.5%) was observed between clade I and clade II specimens (Fig. 2).
The most frequent haplotype was H1, followed by H2. Both haplotypes were found in most of the studied sites, being particularly frequent in the municipalities of Tapachula, Cacahoatán, Unión Juárez, Acacoyagua, and San Pablo. On the other hand, H6 was exclusively detected in SU, in the municipality of Cacahoatán. H3 and H4 were restricted to LC, in Acacoyagua, while H5 was only found in BR, in Tapachula. The distribution of haplotypes by municipality and their frequencies are shown in Table 3. The inferred haplotype network identified H1 as the central, while the other haplotypes appeared as its derivatives. H4 diverged from H1 by 90 mutational steps, whereas H2, H5, and H6 diverged from H1 by only 1 mutational step (Fig. 3C).
Discussion
This study presents the first genetic description of M. hypothenemi populations, a nematode endoparasite of H. hampei, whose presence has only been naturally recorded in several coffee plantations in Mexico (Pérez et al., 2014). The genetic variability of M. hypothenemi suggests significant differentiation among its populations. Although not all populations exhibit the same degree of differentiation, the results support the hypothesis that this parasite is endemic to southeastern Mexico (Poinar et al., 2004). The genetic complexity of the populations of this parasite is similar to that observed in populations of endemic species (Blouin et al., 1999; Stock 2009).
This study also includes the first genetic sequences of M. hypothenemi in the BOLD System database. The COI gene has not yet been widely adopted as a tool for identifying parasitic nematode species, a high genetic structure in M. hypothenemi, an obligate parasite of H. hampei.
Table 2
Estimation of the genetic diversity in 18 populations of the nematode M. hypothenemi collected in the Soconusco region, Chiapas, Mexico.
| Population | N | S | H | Su | Hd (± SD) | Π (± SD) | K | Tajima | Fu and Li | |
| D | D | F | ||||||||
| SL | 5 | 1 | 2 | 0 | 0.600 (0.175) | 0.0010 (0.0003) | 0.600 | 1.224 | 1.224 | 1.157 |
| BR | 5 | 0 | 1 | 0 | 0 | 0 | 0 | 0 | 0 | 0 |
| SU | 4 | 2 | 3 | 2 | 0.833 (0.222) | 0.0017 (0.0006) | 1.000 | -0.709 | -0.709 | -0.604 |
| LA | 2 | 1 | 2 | 1 | 1 (0.500) | 0.0017 (0.0008) | 1 | – | – | – |
| EZ | 4 | 0 | 1 | 0 | 0 | 0 | 0 | 0 | 0 | 0 |
| LU | 4 | 1 | 2 | 1 | 0.500 (0.265) | 0.0008 (0.0004) | 0.500 | -0.612 | -0.612 | -0.478 |
| DM | 5 | 1 | 2 | 1 | 0.400 (0.237) | 0.0007 (0.0004) | 0.400 | -0.816 | -0.816 | -0.771 |
| FO | 3 | 1 | 2 | 1 | 0.666 (0.314) | 0.0011 (0.0000) | 0.666 | – | – | – |
| RI | 5 | 0 | 1 | 0 | 0 | 0 | 0 | 0 | 0 | 0 |
| SA | 5 | 1 | 2 | 1 | 0.400 (0.237) | 0.0007 (0.0000) | 0.400 | -0.816 | -0.816 | -0.771 |
| SD | 2 | 0 | 1 | 0 | 0 | 0 | 0 | – | – | – |
| SR | 5 | 0 | 1 | 0 | 0 | 0 | 0 | 0 | 0 | 0 |
| SJ | 4 | 0 | 1 | 0 | 0 | 0 | 0 | 0 | 0 | 0 |
| MP | 5 | 0 | 1 | 0 | 0 | 0 | 0 | 0 | 0 | 0 |
| RS | 5 | 0 | 1 | 0 | 0 | 0 | 0 | 0 | 0 | 0 |
| OA | 4 | 0 | 1 | 0 | 0 | 0 | 0 | 0 | 0 | 0 |
| LC | 4 | 92 | 3 | 91 | 0.833 (0.222) | 0.0824 (0.0431) | 46.166 | -0.836 | -0.836 | -0.895 |
| BV | 5 | 0 | 1 | 0 | 0 | 0 | 0 | 0 | 0 | 0 |
| Total | 76 | 93 | 6 | 0 | 0.519 (0.056) | 0.0134 (0.0067) | 7.6291 | -2.0622* | 2.1674** | 0.5539 |
N, Number of sequences; S, number of segregating sites; H, number of haplotypes; Su, number of unique sites; Hd, haplotype diversity; Π, nucleotide diversity; K, average number of nucleotide differences. ±SD: Standard deviation. The D Tajima index (Tajima, 1989), D and F of Fu and Li (Fu & Li, 1993). The hyphen represents an estimate not performed due to a limited number of sequences used. * p < 0.05 ** p < 0.02.
Identifying and detecting M. hypothenemi using classical taxonomy remains challenging due to its small size and the subtlety of its morphological characteristics, requiring a fast and reliable method such as DNA barcoding (Gonçalves et al., 2021). For example, 11 new marine nematode species from the Mexican Caribbean have been identified using this technique (Martínez et al., 2020). However, the COI gene has not yet been widely used to identify parasitic nematode species. To date, only 2 species have been reported naturally parasitizing adult coffee berry borers: Panagrolaimus sp. in India (Varaprasad, 1994) and M. hypothenemi in Mexico (Castillo et al., 2002). Nevertheless, the presence of M. hypothenemi has only been detected in this region of the world, and its identification through DNA barcoding could expand our understanding of this species’ geographic range.
Molecular analyses using the COI gene identified 6 haplotypes distributed among the sampled populations, with moderate global genetic diversity (Hd = 0.52) (Wang, 2020). This level of genetic diversity, although lower than that reported for other nematodes such as Heterorhabditis bacteriophora (Hd = 0.8; Saeb & David, 2014), is notable considering the limited geographic distribution of M. hypothenemi and the environmental pressures it faces in Soconusco coffee plantations (Simota et al., 2024). However, this genetic diversity was higher compared to other studies that used 40-120 specimens per population (Klimpel et al., 2007; Powers et al., 2018), possibly due to the number of samples used per population or the high evolutionary rate of mitochondrial DNA (Avise et al., 1987; Brown et al., 1979). Therefore, our sample size may have influenced the estimation of population parameters, and a larger number of specimens per population is recommended in future studies. The observed genetic diversity reflects the adaptive capacity of populations to environmental changes or selective pressure (Clarke, 1979), key aspects for the survival of M. hypothenemi in a fragmented environment. In this sense, understanding the genetic variation of this nematode is essential for designing management and conservation strategies aimed at preserving its role as a potential biological regulator of H. hampei.
Table 3
Frequency of female haplotypes for 18 populations of the nematode Metaparasitylenchus hypothenemi collected in the Soconusco region, Chiapas, Mexico and San Pablo, Guatemala.
| Municipality | Population | *N | Haplotipe frequency |
| Tapachula | SL | 5 | H1(2), H2(3) |
| BR | 5 | H5(5) | |
| Cacahoatán | SU | 4 | H1(1), H2(2), H6(1) |
| LA | 2 | H1(1), H2(1) | |
| EZ | 4 | H2(4) | |
| LU | 4 | H1(3), H2(1) | |
| DM | 5 | H1(4), H2(1) | |
| FO | 3 | H1(2), H2(1) | |
| RI | 5 | H1(5) | |
| SA | 5 | H1(1), H2(4) | |
| Unión Juárez | SD | 2 | H1(2) |
| SR | 5 | H1(5) | |
| SJ | 4 | H1(4) | |
| MP | 5 | H1(5) | |
| RS | 5 | H1(5) | |
| OA | 4 | H1(4) | |
| Acacoyagua | LC | 4 | H1(1), H3(2), H4(1) |
| San Pablo | BV | 5 | H1(5) |
* Number of sequences used in the analysis; the number in parenthesis is the female specimens observed for each haplotype.
Selective neutrality analyses showed significant negative values at a global level, which commonly occur in populations undergoing demographic expansion (Schmidt, 2002), a process that likely began when this pest invaded Mexico in 1978 (Baker, 1984). Selective neutrality analyses revealed negative values for the DM, SA, and LC populations, while the SL population presented a positive value. Neutrality values within populations were not significant, indicating that the studied populations are not under the effects of natural selection (Schmidt, 2002). Therefore, it is feasible that the parasitism of H. hampei by M. hypothenemi represents a novel ecological interaction, as often occurs when a parasite is introduced into a new environment (Bush et al., 2001).
The determination of the origin of the parasite and the age of a parasite-host interaction is complex, due to the variety of mechanisms involved in the historical evolution of parasitism, including the possibility of an initial accidental association (Rico, 2011). The diversity of scolytines associated with coffee plantations in the Soconusco region is very high (Equihua, 1992), and H. hampei is endemic to Africa (Le Pelley, 1968), where populations can reach up to 11 million adults per hectare in mixed plantations of Robusta and Arabica coffee (Baker & Barrera, 1993). Under these conditions, it is likely that an endemic parasitic nematode from this region formed one or more new host-parasite associations with H. hampei (Bickford et al., 2007). Indeed, Poinar et al. (2004) hypothesized that M. hypothenemi first infected the insect in the New World.
Genetic differentiation analyses (FST) revealed high genetic differentiation among M. hypothenemi populations (FST = 0.66, p < 0.05), with gene flow that, in general, is very limited (Nm = 0.50), possibly due to the nematode’s dependence on host movement and the physical barriers imposed by a fragmented landscape (Ali et al., 2016; Fonseca & Netto, 2006; McGaughran et al., 2014). AMOVA confirmed that most genetic variation is found between populations (66.61%), indicating significant genetic structure and rejecting the hypothesis of panmixia. The observed level of genetic differentiation (FST = 0.66) suggests significant population structure, making panmixia unlikely. Additionally, the grouping of populations according to the 2 identified phylogenetic lineages revealed even greater genetic differentiation (FST = 0.99, p < 0.01). This high level of differentiation suggests strong genetic structuring, further reinforcing the rejection of panmixia. These findings highlight the need for further biological studies on M. hypothenemi to explore the existence of 2 lineages or even
distinct species.
Table 4
Genetic (FST) and geographic distances (km, above the diagonal in bold) calculated for 18 populations of the nematode M. hypothenemi collected in the Soconusco region, Chiapas, Mexico and San Pablo, Guatemala.
| LA | SD | EZ | LU | DM | FO | SR | SJ | MP | RI | RS | OA | SL | *BV | LC | BR | SU | SA | |
| LA | 0 | 9.36 | 1.70 | 4.54 | 3.38 | 3.39 | 7.20 | 5.40 | 10.68 | 4.82 | 12.75 | 4.82 | 6.19 | 22.67 | 64.85 | 15.38 | 1.92 | 5.59 |
| SD | 0 | 0 | 7.84 | 7.29 | 6.27 | 6.29 | 2.54 | 4.07 | 2.50 | 6.49 | 4.86 | 5.37 | 15.20 | 13.59 | 73.49 | 24.65 | 11.14 | 5.94 |
| EZ | 0.38 | 1 | 0 | 3.10 | 2.45 | 2.48 | 5.86 | 4.05 | 9.36 | 3.22 | 11.55 | 3.91 | 7.90 | 21.01 | 66.55 | 17.03 | 3.30 | 3.95 |
| LU | 0 | 0 | 0.66 | 0 | 4.59 | 4.64 | 6.2 | 4.81 | 9.42 | 0.79 | 11.82 | 5.65 | 10.51 | 19.32 | 68.99 | 19.12 | 5.39 | 1.51 |
| DM | 0 | 0 | 0.72 | 0 | 0 | 0.04 | 3.91 | 2.20 | 7.33 | 4.28 | 9.36 | 1.48 | 8.92 | 19.83 | 67.34 | 18.39 | 5.30 | 4.67 |
| FO | 0 | 0 | 0.57 | 0 | 0 | 0 | 3.92 | 2.22 | 7.32 | 4.32 | 9.35 | 1.46 | 8.91 | 19.84 | 67.31 | 18.38 | 5.32 | 4.71 |
| SR | 0.47 | 0 | 1 | 0.06 | 0 | 0.18 | 0 | 1.81 | 3.49 | 5.50 | 5.74 | 2.85 | 12.80 | 16.11 | 70.96 | 22.30 | 9.07 | 5.25 |
| SJ | 0.38 | 0 | 1 | 0 | 0 | 0.11 | 0 | 0 | 5.31 | 4.18 | 7.51 | 1.62 | 11.13 | 17.63 | 69.50 | 20.59 | 7.26 | 4.16 |
| MP | 0.47 | 0 | 1 | 0.06 | 0 | 0.18 | 0 | 0 | 0 | 8.64 | 2.41 | 6.05 | 16.04 | 13.54 | 73.70 | 25.57 | 12.56 | 8.21 |
| RI | 0.47 | 0 | 1 | 0.06 | 0 | 0.18 | 0 | 0 | 0 | 0 | 11.04 | 5.18 | 10.93 | 18.61 | 69.50 | 19.70 | 5.89 | 0.82 |
| RS | 0.47 | 0 | 1 | 0.06 | 0 | 0.18 | 0 | 0 | 0 | 0 | 0 | 7.97 | 17.76 | 13.15 | 74.73 | 27.26 | 14.66 | 10.62 |
| OA | 0.38 | 0 | 1 | 0 | 0 | 0.11 | 0 | 0 | 0 | 0 | 0 | 0 | 10.00 | 18.96 | 68.12 | 19.53 | 6.75 | 5.37 |
| SL | 0 | 0.28 | 0.19 | 0 | 0.10 | 0 | 0.5 | 0.45 | 0.5 | 0.5 | 0.5 | 0.45 | 0 | 28.72 | 58.65 | 9.52 | 5.18 | 11.72 |
| *BV | 0.47 | 0 | 1 | 0.06 | 0 | 0.18 | 0 | 0 | 0 | 0 | 0 | 0 | 0.5 | 0 | 87.08 | 38.05 | 24.25 | 17.81 |
| LC | 0.52 | 0.52 | 0.66 | 0.66 | 0.70 | 0.60 | 0.70 | 0.66 | 0.70 | 0.70 | 0.70 | 0.66 | 0.70 | 0.70 | 0 | 50.05 | 63.61 | 70.31 |
| BR | 0.85 | 1 | 1 | 0.82 | 0.83 | 0.82 | 1 | 1 | 1 | 1 | 1 | 1 | 0.81 | 1 | 0.70 | 0 | 13.85 | 20.53 |
| SU | 0 | 0.31 | 0 | 0.14 | 0.24 | 0 | 0.55 | 0.5 | 0.55 | 0.55 | 0.55 | 0.5 | 0 | 0.55 | 0.66 | 0.78 | 0 | 6.71 |
| SA | 0 | 0.62 | 0 | 0.31 | 0.41 | 0.15 | 0.75 | 0.72 | 0.75 | 0.75 | 0.75 | 0.72 | 0 | 0.75 | 0.70 | 0.88 | 0 | 0 |
* Site located in San Pablo, Guatemala.
Pairwise FST values showed that some populations, such as EZ, BR, and LC, exhibit high genetic differentiation compared to other populations, despite moderate geographic distances (average of 1.7-87.5 km). This suggests that these geographic distances might be sufficient to induce isolation by distance, although the presence of specific environmental characteristics or geographic barriers could also play a role. However, the presence of one common haplotype alongside 3 highly divergent ones could indicate the existence of cryptic lineages, migration from other populations, or the persistence of ancestral genetic diversity (Blouin et al., 1995; Chávez-González et al., 2022; Nieberding et al., 2005). Further studies with a larger sample size and broader geographic coverage are needed to clarify these patterns. On the other hand, the FO and DM populations, separated by only 0.04 km, showed no genetic differentiation, suggesting a high degree of gene flow between them, likely facilitated by their geographic proximity and a more homogeneous landscape.
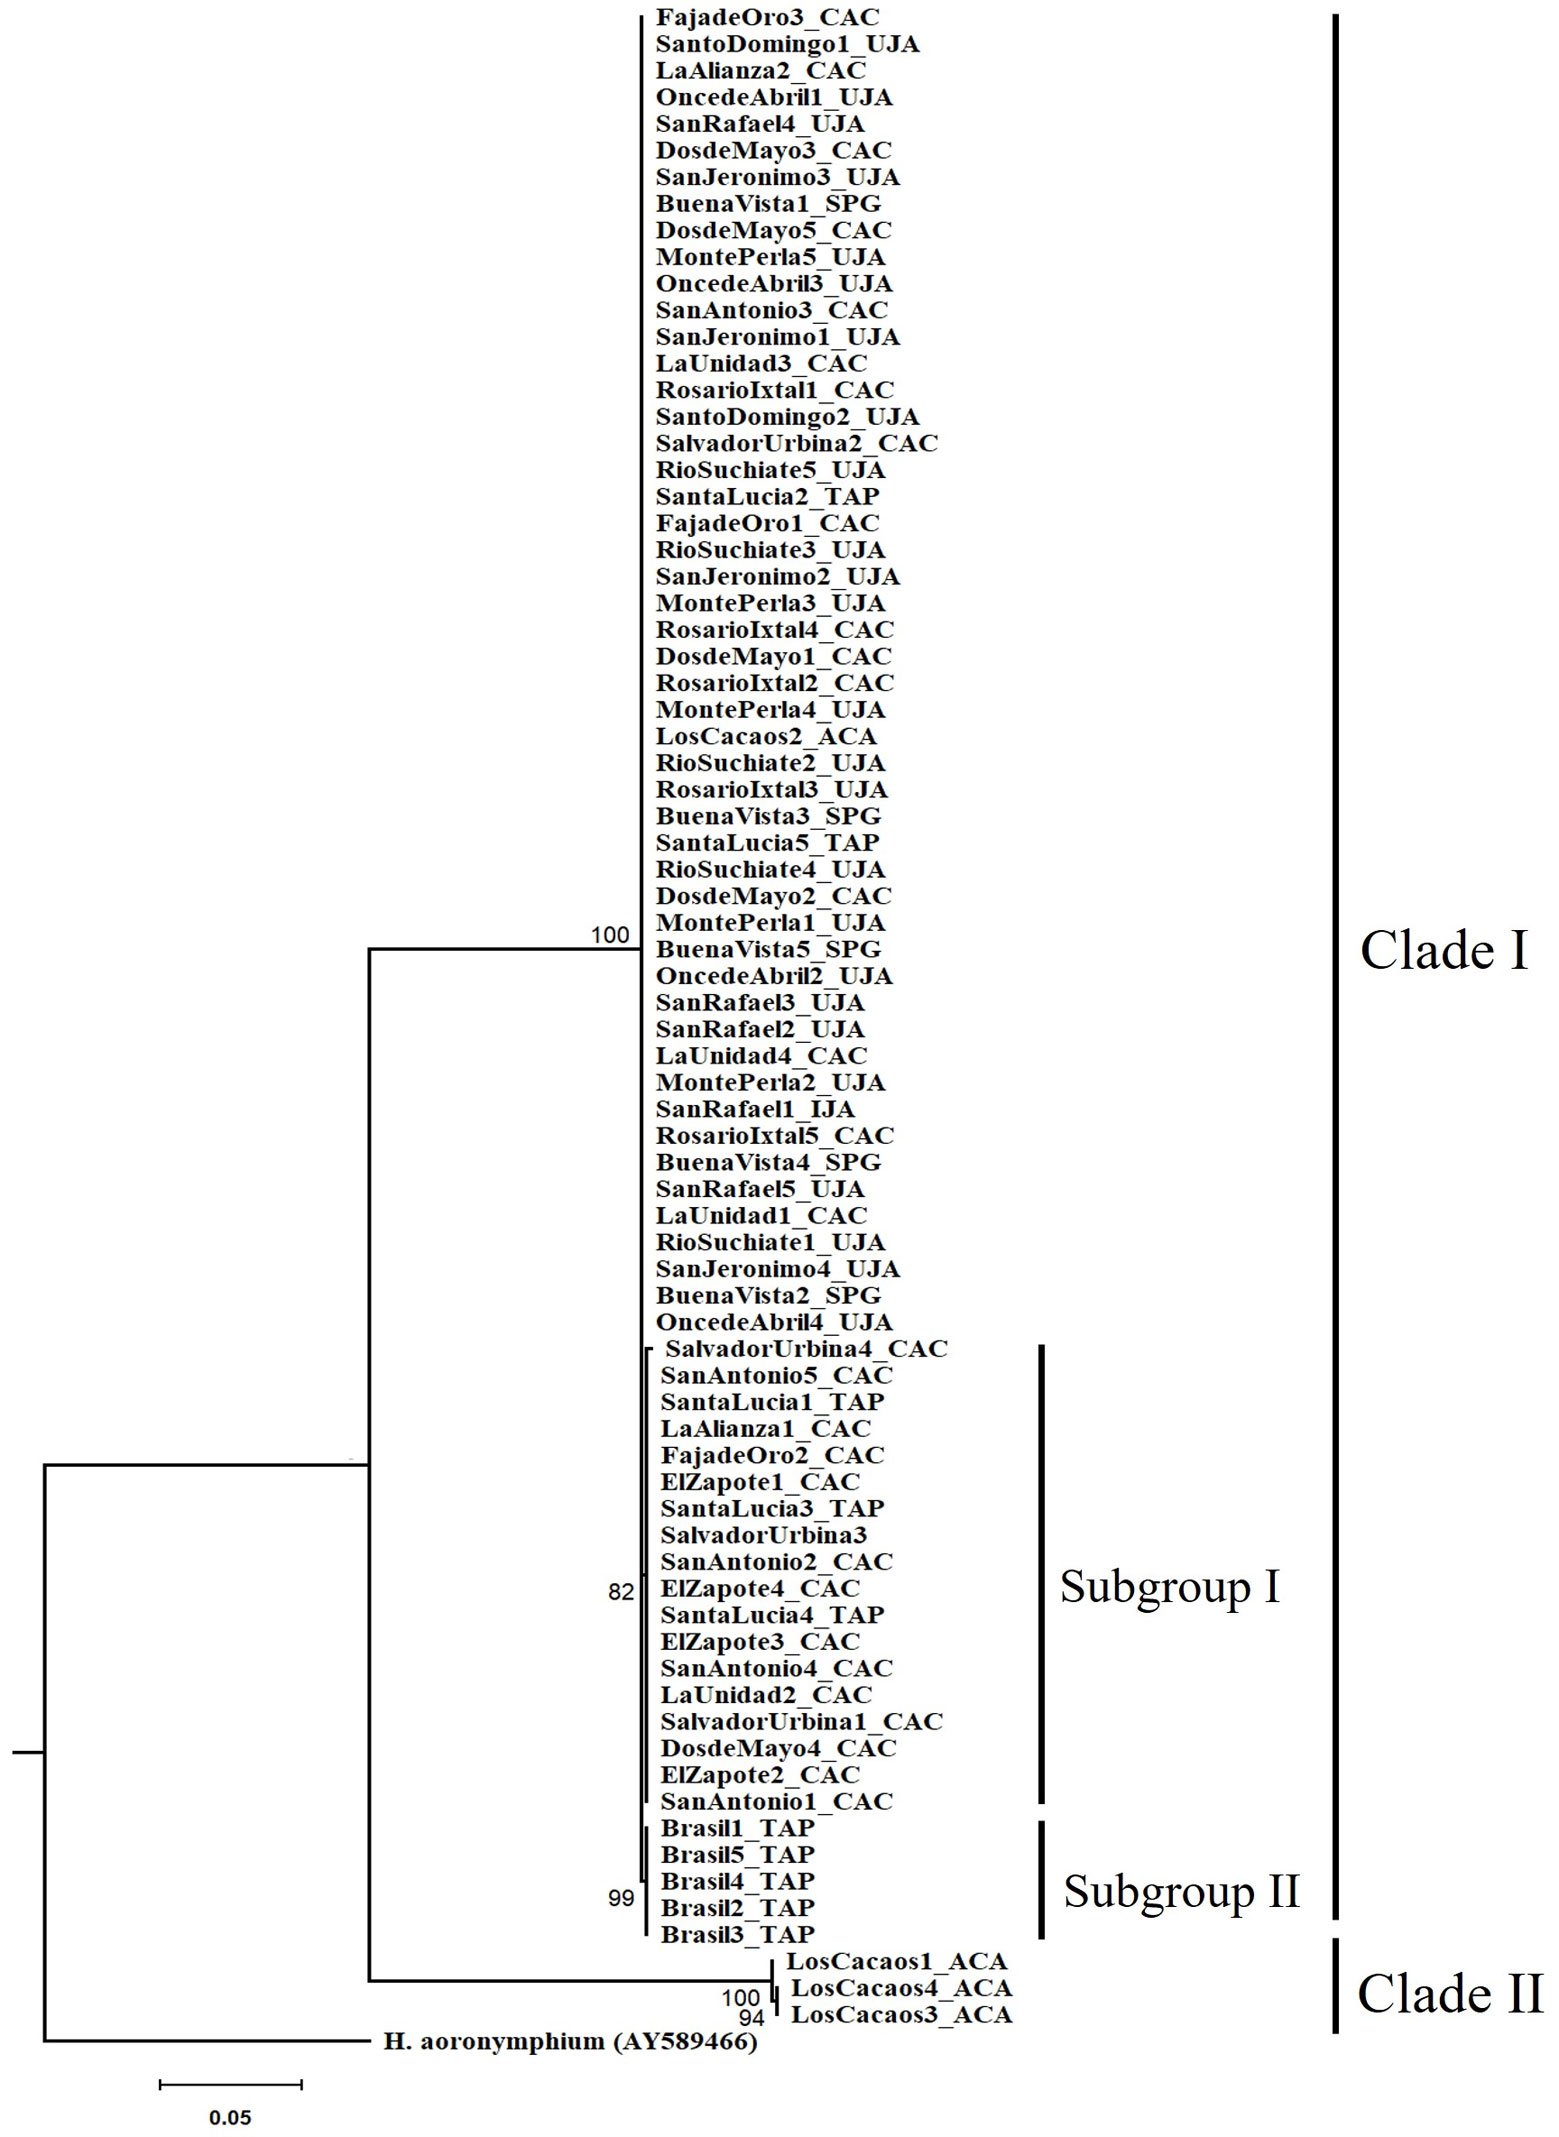
Figure 2. Phylogenetic relationships of Metaparasitylenchus hypothenemi (76 sequences) using maximum likelihood. A sequence of the parasitic nematode Howardula aoronymphium (Tylenchidae: Allantonematidae) was used as outgroup (GenBank AY589466). The scale bar represents the number of expected nucleotide substitutions per site. Municipalities: TAP, Tapachula; UJA, Unión Juárez; CAC, Cacahoatán; ACA, Acacoyagua y SPG, San Pablo Guatemala. The numbers between the nodes in the tree correspond to bootstrap values.
The high genetic differentiation detected in this study could have important implications for the conservation of M. hypothenemi. On one hand, it suggests that populations are undergoing local adaptation processes, which could result in genetically distinct lineages that might be lost if their specific habitats are not protected. The significant correlation between genetic and geographic distances (r = 0.4728, p < 0.0001) obtained through the Mantel test supports the hypothesis of a pattern of isolation by distance. However, the moderate correlation value suggests that, in addition to geographic distance, other factors such as local environmental conditions, coffee plantation management practices, or landscape fragmentation may also contribute to the observed genetic differentiation (Diniz-Filho et al., 2013).
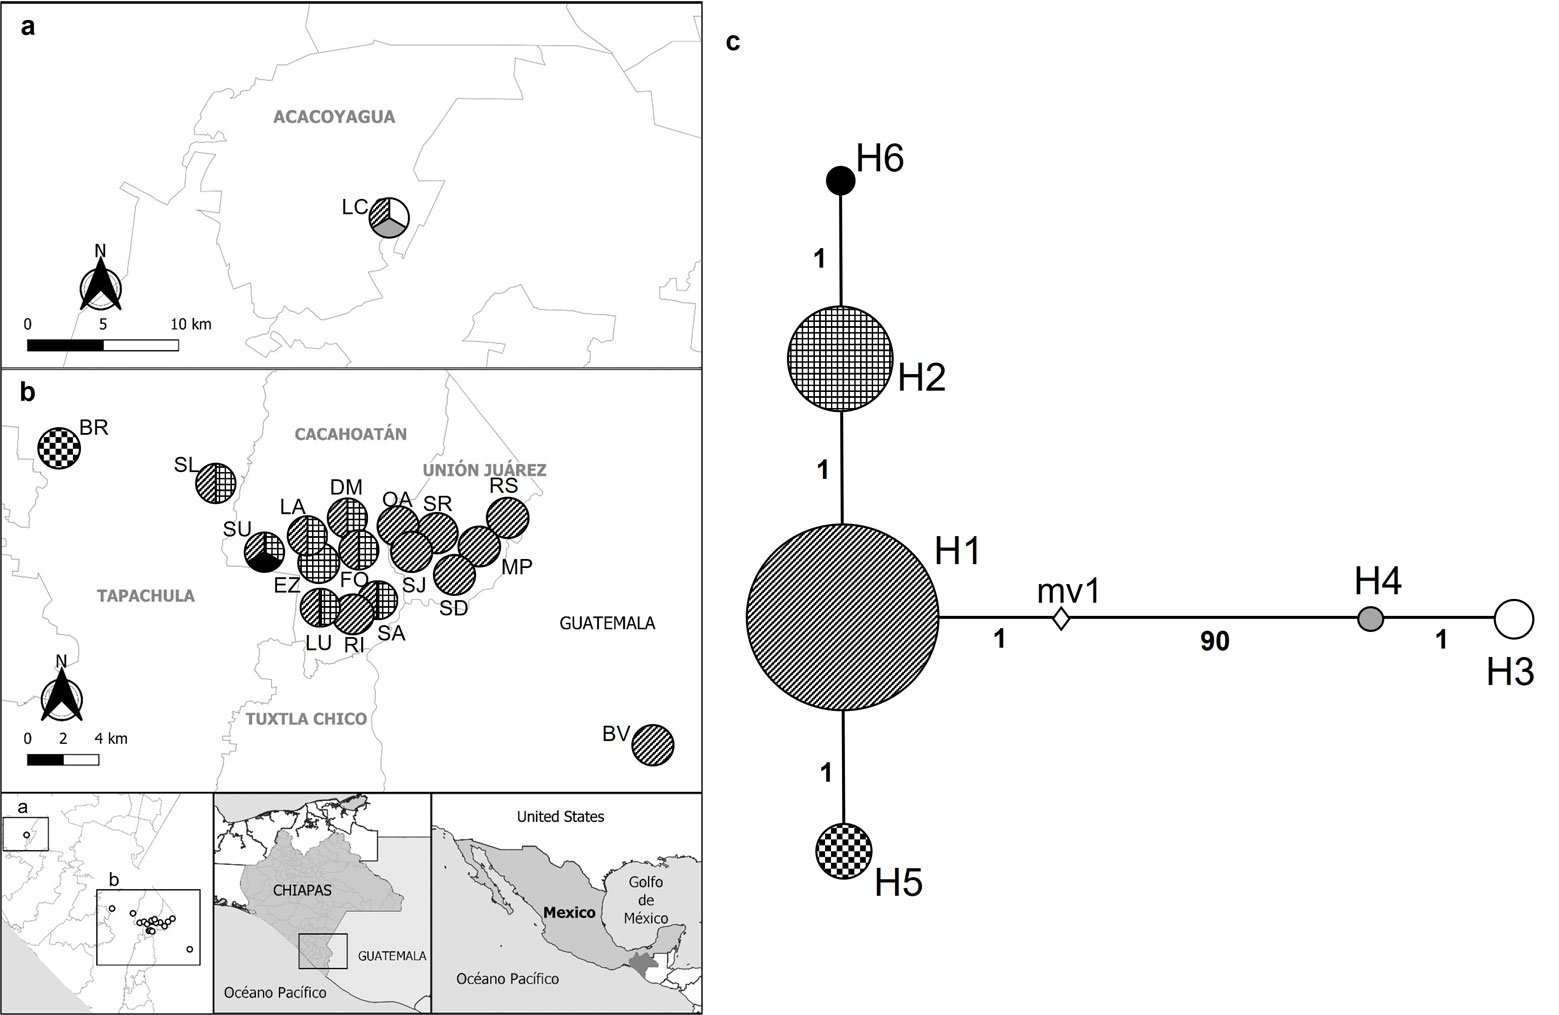
Figure 3. a-b, Distribution of the Metaparasitylenchus hypothenemi haplotypes in the 5 municipalities from the Soconusco region, Chiapas, Mexico and the municipality of San Pablo, Guatemala; c, haplotype network development using PopART v. 1.7. Wefts of the circles represent each haplotype. The size of the circles is proportional to the frequency of the haplotype inside the populations. The numbers on the lines connecting the haplotypes represent the mutational steps. The white rhombus (mv1) represents an extinct haplotype or an unsampled point. LC, Ejido Los Cacaos; LA, La Alianza; EZ, El Zapote; LU, La Unidad; DM, Dos de Mayo; FO, Faja de Oro; RI, Rosario Ixtal, SA, San Antonio: BV, Buena Vista; SU, Salvador Urbina; SL, Santa Lucía; BR, Brasil; SD, Santo Domingo; SR, San Rafael; SJ, San Jerónimo; MP, Monte Perla; RS, Río Suchiate; OA, Once de Abril.
The presence of 2 well-differentiated clades with high phylogenetic support (> 90%) suggests complex evolutionary processes. Clade I, which includes 96% of specimens distributed in the municipalities of Tapachula, Cacahoatán, Unión Juárez, and San Pablo, also showed internal substructures, indicating genetic differentiation within these populations. The formation of these subgroups could be interpreted as a possible response to geographic isolation or ecological barriers that have favored genetic divergence among populations (Wright, 1943). On the other hand, Clade II, composed only of 3 specimens from the LC population, showed a 16.4% phylogenetic separation from Clade I. This differentiation is considerably high and exceeds the intraspecific threshold generally accepted for genetic barcoding (1-2%; Lanteri, 2007). However, studies on nematodes have reported higher genetic divergences between species, as observed in Rhabdochona spp., where genetic differentiation range from 11% to 15% (Caspeta-Mandujano et al., 2021; Santacruz et al., 2020). This suggests that further comparisons with closely related taxa are needed to determine whether this divergence corresponds to an ongoing speciation process or represents intraspecific variation. The existence of 2 well-differentiated clades raises interesting questions about the evolutionary and ecological processes shaping M. hypothenemi populations. One possibility is that these differences reflect a conserved ancestral lineage in certain geographically isolated populations, such as LC. Another possibility is that the exclusive haplotypes are the result of recent local adaptation events or genetic drift in response to landscape fragmentation (Cheptou et al., 2017; Safran & Nosil, 2012). It is also plausible that these differences reflect the presence of a different species or a cryptic species with conserved morphology but genetic divergence. To confirm the occurrence of this genetic divergence process, further genetic studies with greater representation of the isolated population, as well as additional morphological studies, would be necessary. The use of nuclear markers would be particularly useful to determine whether the observed genetic differentiation is restricted to mitochondrial DNA or also occurs at the genome-wide level.
The haplotype analysis supports the hypothesis of genetic differentiation among populations. The high frequency and wide distribution of haplotype H1 found in most of the studied sites, suggest that it may represent the ancestral haplotype and the origin of other derived haplotypes. Nevertheless, the high divergence observed between haplogroups, particularly the separation of H4 by 90 mutational steps, indicates significant genetic structuring and highlights the complexity of inferring ancestral states (Avise, 2000). Therefore, it is not possible to confirm H1 as the ancestral haplotype without additional phylogenetic or coalescent analyses. In contrast, the exclusivity of H3 and H4 in the LC population, as well as H6 in SU and H5 in BR, reflects possible geographic isolation, local adaptation, and genetic drift processes (Forster, 2004).
These patterns are consistent with the theory that M. hypothenemi populations are influenced by geographic barriers that restrict gene flow and promote differentiation among localities. The search for this parasitism in the entire study region is required to determine the possibility of a greater number of M. hypothenemi haplotypes. The greater genetic difference of M. hypothenemi was observed in the population with greater geographical isolation (100 km), suggesting that more haplotypes could be located as more sites with the presence of the parasite are detected. Consequently, a complete genetic description of the M. hypothenemi populations require of the location of new sites with presence of this parasitism, whether in the study region or other coffee-growing regions of Chiapas and Central America.
This study added 6 new geographic records for M. hypothenemi, in addition to those previously known (Pérez et al., 2015). However, we believe that the identification of new sites might be influenced by the result of random interactions caused by the transport of infested fruits with the pest and the adaptation of the parasite to local climatic conditions.
This study provides the first evidence of the American origin of this nematode. Our study also opens possibilities for future research on the genetic and geographic diversity of this species, its relationship with environmental variables. These aspects are essential for designing conservation strategies for this species and its management for the control of H. hampei, an important global pest.
Acknowledgements
Special thanks to Guadalupe Eugenia Zarza Franco for her assistance in interpreting the results, to Fernando E. Vega for the comments on the manuscript, and to Jose Higinio López Urbina for making the maps.
References
Akaike, H. (1974). A new look at the statistical model identification. IEEE Transactions on Automatic Control, 19, 716–723. https://doi.org/10.1109/TAC.1974.1100705
Ali, N., Tavoillot, J., Chapuis, E., & Mateille, T. (2016). Trend to explain the distribution of root–knot nematodes Meloidogyne spp. associated with olive trees in Morocco. Agriculture, Ecosystems and Environment, 225, 22–32. https://doi.org/10.1016/j.agee.2016.03.042
Avise, J. C. (2000). Phylogeography: the history and formation of species (Vol. 447). Cambridge, Massachusetts, London England: Harvard University Press.
Avise, J. C., Arnold, J., Ball, R. M., Bermingham, E., Lamb, T., Neige, J. E., Reeb, C. A., & Saunders, N. C. (1987). Intraspecific phylogeography: the mitochondrial DNA bridge between population genetics and systematics. Annual Review of Ecology and Systematics, 18, 489–522. https://doi.org/10.1146/annurev.es.18.110187.002421
Baker, P. S. (1984). Some aspects of the behaviour of the coffee berry borer in relation to its control in southern Mexico (Coleoptera: Scolytidae). Folia Entomológica Mexicana, 61, 9–24.
Baker, P. S., & Barrera, J. F. (1993). A field study of a population of coffee berry borer, Hypothenemus hampei (Coleoptera; Scolytidae), in Chiapas, Mexico. Tropical Agriculture, 70, 351–355.
Bickford, D., Lohman, D. J., Sodhi, N. S., Ng, P. K., Meier, R., Winker, K., Ingram, K. K., & Das, I. (2007). Cryptic species as a window on diversity and conservation. Trends in Ecology and Evolution, 22, 148–155. https://doi.org/10.1016/j.tree.2006.11.004
Blouin, M. S., Liu, J., & Berry, R. E. (1999). Life cycle variation and the genetic structure of nematode populations. Heredity, 83, 253–259. https://doi.org/10.1038/sj.hdy.6885420
Blouin, M. S., Yowell, C. A., Courtney, C. H., & Dame, J. B. (1995). Host movement and the genetic structure of populations of parasitic nematodes. Genetics, 141, 1007–1014. https://doi.org/10.1093/genetics/141.3.1007
Brown, W. M., George, M., & Wilson, A.C. (1979). Rapid evolution of animal mitochondrial DNA. Proceedings of the National Academy of Sciences, 76, 1967–1971. https://doi.org/10.1073/pnas.76.4.1967
Bush, A. O., Fernández, J. C., Esch, G. W., Seed, J. R., & Ndez, J. C. F. (2001). Parasitism: the diversity and ecology of animal parasites. Cambridge, UK: Cambridge University Press.
Castillo, A., Infante, F., Barrera, J. F., Carta, L., & Vega, F. E. (2002). First field report of a nematode (Tylenchida: Sphaerularioidea) attacking the coffee berry borer, Hypothenemus hampei (Ferrari) (Coleoptera: Scolytidae) in the Americas. Journal of Invertebrate Pathology, 79, 99–202. https://doi.org/10.1016/S00222011(02)00024-1
Castillo, A., Martínez, F., Gómez, J., Cisneros, J., & Vega, F. E. (2019). Sterility of the coffee berry borer, Hypothenemus hampei (Coleoptera: Curculionidae), caused by the nematode Metaparasitylenchus hypothenemi (Tylenchidae: Allantonematidae). Biocontrol Science and Technology, 29, 786–795. https://doi.org/10.1080/09583157.2019.1597336
Caspeta-Mandujano, J. M., Salinas-Ocampo, J. C., Suárez-Rodríguez, R., Martínez-Ramírez, C., & Matamoros, W. A. (2021). Morphological and molecular evidence for a new rhabdochonid species, Rhabdochona (Nematoda: Rhabdochonidae), parasitizing Eugerres mexicanus (Perciformes: Gerreidae), from the Lacantún River in the Biosphere Reserve of Montes Azules, Chiapas, Mexico. Revista Mexicana de Biodiversidad, 92, 01–11. https://doi.org/10.22201/ib.20078706e.2021.92.3266
Cháves-González, L. E., Morales-Calvo, F., Mora, J., Solano-Barquero, A., Verocai, G. G., & Rojas, A. (2022). What lies behind the curtain: Cryptic diversity in helminth parasites of human and veterinary importance. Current Research in Parasitology & Vector-Borne Diseases, 2, 100094. https://doi.org/10.1016/j.crpvbd.2022.100094
Cheptou, P. O., Hargreaves, A. L., Bonte, D., & Jacquemyn, H. (2017). Adaptation to fragmentation: evolutionary dynamics driven by human influences. Philosophical Transactions of the Royal Society B: Biological Sciences, 372, 20160037. https://doi.org/10.1098/rstb.2016.0037
Clarke, B. C. (1979). The evolution of genetic diversity. Proceedings of the Royal Society of London. Series B. Biological Sciences, 205, 453–474. https://doi.org/10.1098/rspb.1979.0079
Diniz-Filho, J. A. F., Soares, T. N., Lima, J. S., Dobrovolski, R., Landeiro, V. L., Telles, M. P. D. C., & Bini, L. M. (2013). Mantel test in population genetics. Genetics and Molecular Biology, 36, 475–485. https://doi.org/10.1590/S141547572013000400002
Equihua, M. A. (1992). Coleópteros Scolytidae atraídos a trampas NTP–80 en el Soconusco, Chiapas, México. Folia Entomológica Mexicana, 84, 55–66.
Excoffier, L., & Lischer, H. E. L. (2010). Arlequin suite ver 3.5: a new series of programs to perform population genetics analyses under Linux and Windows. Molecular Ecology Resources, 10, 564–567. https://doi.org/10.1111/j.
1755-0998.2010.02847.x
Fitza, K. N., Garnas, J. R., Lombardero, M. J., Ayres, M. P., Krivak–Tetley, F. E., Ahumada, R., & Slippers, B. (2019). The global diversity of Deladenus siricidicola in native and non–native populations. Biological Control, 132, 57–65. https://doi.org/10.1016/j.biocontrol.2019.01.014
Fonseca, G., & Netto, S. A. (2006). Shallow sublittoral benthic communities of the Laguna estuarine system, Brazilian Journal of Oceanography, 54, 41–54.
Forster, P. (2004). Ice ages and the mitochondrial DNA chronology of human dispersals: a review. Philosophical Transactions of the Royal Society, 359, 255–264. https://doi.org/10.1098/rstb.2003.1394
Fu, Y. X., & Li, W. H. (1993). Statistical tests of neutrality of mutations. Genetics, 133, 693–709. https://doi.org/10.1093/genetics/133.3.693
Gonçalves, L. T., Bianchi, F. M., Deprá, M., & Calegaro-Marques, C. (2021). Barcoding a can of worms: testing cox1 performance as a DNA barcode of Nematoda. Genome, 64, 705–717. https://doi.org/10.1139/gen-2020-0140
Hajibabaei, M., DeWaard, J. R., Ivanova, N. V., Ratnasingham, S., Dooh, R. T., Kirk, S. L. et al. (2005). Critical factors for assembling a high volume of DNA barcodes. Philosophical Transactions of the Royal Society B: Biological Sciences, 360, 1959–1967. https://doi.org/10.1098/rstb.2005.1727
Hartshorn, J. A., Fisher, J. R., Riggins, J. J., & Stephen, F. M. (2017). Molecular identification of Deladenus proximus Bedding, 1974 (Tylenchida: Neotylenchidae), a parasite of Sirex nigricornis (Hymenoptera: Siricidae). Nematology, 19, 15–20. https://doi.org/10.1163/15685411-00003029
Hebert, P. D., Cywinska, A., Ball, S. L., & Dewaard, J. R. (2003). Biological identifications through DNA barcodes. Proceedings of the Royal Society of London. Series B: Biological Sciences, 270, 313–321. https://doi.org/10.1098/rspb.2002.2218
Ivanova, N. V., Dewaard, J. R., & Hebert, P. D. (2006). An inexpensive, automation-friendly protocol for recovering high-quality DNA. Molecular Ecology Notes, 6, 998–1002. https://doi.org/10.1111/j.1471-8286.2006.01428.x
Klimpel, S., Kleinertz, S., Hanel, R., & Rückert, S. (2007). Genetic variability in Hysterothylacium aduncum, a raphidascarid nematode isolated from sprat (Sprattus sprattus) of different geographical areas of the northeastern Atlantic. Jounal Parasitology Research, 101, 1425–1430. https://doi.org/10.1007/s00436-007-06620
Kumar S., Stecher G., Li M., Knyaz C., & Tamura K. (2018). MEGA X: molecular Evolutionary Genetics Analysis across computing platforms. Molecular Biology Evolution, 35, 1547–1549. https://doi.org/10.1093/molbev/msy096
Lanteri, A. A. (2007). Código de barras del ADN y sus posibles aplicaciones en el campo de la entomología. Revista de la Sociedad Entomológica Argentina, 66, 15–25.
Le Pelley, R. H. (1968). Pests of coffee. London: Longmans, Green and Co.
Leigh, J. W., Bryant, D., & Nakagawa, S. (2015). POPART: full–feature software for haplotype network construction. Methods in Ecology & Evolution, 6, 1110–1116. https://doi.org/10.1111/2041-210X.12410
Mantel, N. (1967). The detection of disease clustering and a generalized regression approach. Cancer Research, 27, 209–220.
Marsjan, P. A., & Oldenbroek, J. K. (2007). Molecular markers, a tool for exploring genetic diversity. In B. Rischkowsky, & D.Pilling (Eds.), The state of the world’s animal genetic resources for food and agriculture. Rome: Food and Agriculture Organization.
Martínez, A. A., Jesús, N. D., & Leasi, F. (2020). DNA Barcoding for delimitation of putative Mexican marine nematodes species. Diversity, 12, 107. https://doi.org/10.3390/d12030107
McGaughran, A., Morgan, K., & Sommer, R. J. (2014). Environmental variables explain genetic structure in a beetle–associated nematode. Plos One, 9, 87317. https://doi.org/10.1371/journal.pone.0087317
Nieberding, C., Libois, R., Douady, C. J., Morand, S., & Michaux, J. R. (2005). Phylogeography of a nematode (Heligmosomoides polygyrus) in the western Palearctic region: persistence of northern cryptic populations during ice ages? Molecular Ecology, 14, 765–779. https://doi.org/10.1111/j.1365294X.2005.02440.x
Oksanen, J., Blanchet, F. G., Kindt, R., Legendre, P., O’hara, R. B., Simpson, G. L., & Wagner, H. (2010). Vegan: community ecology package. R package version 1.17–4. http://CRAN.R–project.org/package=vegan
Pérez, J., Infante, F., Poinar, G. Jr., Castillo, A., & Vega, F. E. (2015). Natural parasitism of Metaparasitylenchus hypothenemi (Tylenchida: Allantonematidae) on the coffee berry borer in Chiapas, Mexico. Biocontrol Science and Technology, 25, 608–612. https://doi.org/10.1080/09583157.2014.991910
Poinar, G. Jr., Vega, F. E., Castillo, A., Chavéz, I. E., & Infante, F. (2004). Metaparasitylenchus hypothenemi Sp. (Nematoda: Allantonematidae), a parasite of the co-ee berry borer, Hypothenemus hampei (Curculionidae: Scolytinae). Journal of Parasitology, 90, 1106–1110. https://doi.org/10.1645/GE-3369
Posada, D. (2008). Model Test: phylogenetic model averaging. Molecular Biology and Evolution, 25, 1253–1256. https://doi.org/10.1093/molbev/msn083
Powers, T., Harris, T., Higgins, R., Mullin, P., & Powers, K. (2018). Discovery and identification of Meloidogyne species using COI DNA barcoding. Journal of Nematology, 50, 399–412. https://doi.org/10.21307/jofnem-2018-029
Prosser, S., Martínez, A. A., & Elías, G. M. (2013). A new set of primers for COI amplification from freshwater microcrustaceans. Molecular Ecology Resources, 13, 151–1155. https://doi.org/10.1111/1755-0998.12132
Rico, G. (2011). The evolution of host-parasite interactions: coevolution, sexual selection and other suggested theories. Revista UDCA Actualidad and Divulgación Científica, 14, 119–130.
R Core Team (2020). R: a language and environment for statistical computing. R Foundation for Statistical Computing, Vienna, Austria. https://www.R–project.org/
Rozas, J., & Librado, P. (2009). DnaSP v. 5. A software for comprehensive analysis of DNA polymorphism data. Bioinformatics, 25, 1451–1452. https://doi.org/10.1093/bioinformatics/btp187
Saeb, A. T., & David, S. K. (2014). Comparative estimation of genetic diversity in population studies using molecular sampling and traditional sampling methods. Biomedical Informatics, 10, 347–352. https://doi.org/10.6026/9732063
0010347
Safran, R. J., & Nosil, P. (2012). Speciation: the origin of new species. Nature Education Knowledge, 3, 17.
Santacruz, A., Ornelas-García, C. P., & De León, G. P. P. (2020). Diversity of Rhabdochona mexicana (Nematoda: Rhabdochonidae), a parasite of Astyanax spp. (Characidae) in Mexico and Guatemala, using mitochondrial and nuclear genes, with the description of a new species. Journal of Helminthology, 94, 1–11. https://doi.org/10.1017/S0022149X19000014
Simota-Ruiz, M., Castillo, A., Cisneros-Hernández, J., & Carmona-Castro, O. (2024). Predicted distribution of Metaparasitylenchus hypothenemi (Tylenchida: Allantonematidae), parasite of the coffee berry borer. Journal of Nematology, 56, 1–10. https://doi.org/10.2478/jofnem-2024-0031
Schmidt, D., & Pool, J. (2002). The effect of population history on the distribution of the Tajima’s D statistic. Population English Edition, 1, 1–8.
Stamatakis A. (2006). RAxML-VI-HPC: maximum likelihood–based phylogenetic analyses with thousands of taxa and mixed models, Bioinformatics, 22, 2688–2690. https://doi.org/10.1093/bioinformatics/btl446
Stewart, J. B., & Larsson, N. G. (2014). Keeping mtDNA in shape between generations. Plos Genetics, 10, 1–7. https://doi.org/10.1371/journal.pgen.1004670
Stock, S. P. (2009). Molecular approaches and the taxonomy of insect–parasitic and pathogenic nematodes. In S. P. Stock, J. Vandenberg, I. Glazer, & N. Boemare (Eds.), Insect pathogens: molecular approaches and techniques (pp. 71–100). Wallingford UK: CABI. https://doi.org/10.1079/9781845934781.0071
Tajima, F. (1989). Statistical method for testing the neutral mutation hypothesis by DNA polymorphism. Genetics, 123, 585–595. https://doi.org/10.1093/genetics/123.3.585
Varaprasad, K. S., Balasubramanian, S., Diwakar, B. J., & Ramarao, C. V. (1994). First report of an entomogenous nematode, Panagrolaimus sp. from coffee berry borer, Hypothenemus hampei (Ferrari) from Karnataka, India. Plant Protection Bulletin (Faridabad), 46, 34–35.
Wang, S. Q. (2020). Genetic diversity and population structure of the endangered species Paeonia decomposita endemic to China and implications for its conservation. BMC Plant Biology, 20, 1–14. https://doi.org/10.1186/s12870-020-02682-z
Wright, S. (1943). Isolation by distance. Genetics, 28, 114–138. https://doi.org/10.1093/genetics/28.2.114


