
Francisco J. García-De León a, Gorgonio Ruiz-Campos b, *, Jesús Roberto Oyervides-Figueroa c, Gonzalo De León-Girón b, Carlos Alberto Flores-López b, Dante Magdaleno-Moncayo d, Alicia Abadía-Cardoso e
a Centro de Investigaciones Biológicas del Noroeste, S.C., Laboratorio de Genética para la Conservación, Av. Instituto Politécnico Nacional 195, Playa Palo de Santa Rita Sur, 23096 La Paz, Baja California Sur, Mexico
b Universidad Autónoma de Baja California, Facultad de Ciencias, Carretera Ensenada-Tijuana Km. 103 s/n, 22860 Ensenada, Baja California, Mexico
c Centro de Investigación Científica y de Educación Superior de Ensenada, Departamento de Acuicultura, Carretera Tijuana -Ensenada 3918, Zona Playitas, 22860 Ensenada, B.C., Mexico
d Universidad Autónoma de Baja California, Facultad de Ingeniería, Arquitectura y Diseño, Carretera Ensenada-Tijuana Km. 103 s/n, 22860 Ensenada, Baja California, Mexico
e Universidad Autónoma de Baja California, Facultad de Ciencias Marinas, Carretera Ensenada-Tijuana Km. 103 s/n, 22860 Ensenada, Baja California, Mexico
*Corresponding author: gruiz@uabc.edu.mx (G. Ruiz-Campos)
Received: 20 August 2024; accepted: 20 February 2025
Abstract
We assembled and annotated the mitochondrial genome of golden eagles from the northwest of Baja California, Mexico, using reference and de novo strategies to analyze the synteny of mitochondrial genes, the phylogenetic relationships, and genetic variation of mitochondrial DNA. The length of the Golden Eagle mitogenome was 17,472 bp (base pairs) with a base composition of A (29.8%), C (32.5%), G (14.0%), and T (23.6%). The mitogenome contains 13 genes coding for the protein complexes coxI II-III, Cytb, cATP 6 and 8, and Nicotinamide Adenine Dinucleotide (NADH 1-6); this arrangement is consistent with the general model of the mitogenome reported in other congeneric members. Mitogenomes of individuals from northwestern Baja California are unique and they differ from the mitogenome of southern California golden eagles in 3 traits: 1) molecule size is 140 bp larger than that previously reported, 2) the addition in the annotation of a region called pseudo control (ψRC), and 3) the annotation in 2 fractions of the coding region for the protein NADH dehydrogenase subunit 3 (ND3). The genetic diversity and phylogenetic analyses of the individual genes and mitogenome support a close genetic relatedness between the golden eagles from northwestern Baja California and southern California region.
Keywords: Mediterranean region; Mitochondrial lineages; Mitochondrial genome; Next generation sequencing; Non-model species
Mitogenoma de águila real (Aquila chrysaetos) en el noroeste de Baja California, México: relaciones filogenéticas y variación genética
Resumen
Ensamblamos y anotamos el genoma mitocondrial del águila real del noroeste de Baja California, México, utilizando estrategias de referencia y de novo para analizar la sintenia de genes mitocondriales, las relaciones filogenéticas y la variación genética del DNA mitocondrial. La longitud del mitogenoma fue 17,472 pb (pares de bases) con una composición de bases de A (29.8%), C (32.5%), G (14.0%) y T (23.6%). El mitogenoma contiene 13 genes codificantes de los complejos proteínicos coxI II-III, Cytb, cATP 6 y 8, y nicotinamida adenina dinucleótido (NADH 1-6); esto fue consistente con el modelo general del mitogenoma reportado en otros congéneres. Los mitogenomas de individuos del noroeste de Baja California son únicos y se diferencian del mitogenoma de individuos del sur de California en 3 rasgos: 1) el tamaño de molécula es 140 pb más grande que el reportado, 2) adición de la región llamada pseudocontrol (ψRC) y 3) anotación en 2 fracciones de la región codificante de la proteína NADH deshidrogenasa subunidad 3 (ND3). La diversidad genética y los análisis filogenéticos de los genes individuales y el mitogenoma respaldan una estrecha relación genética entre las águilas reales del noroeste de Baja California y la región del sur de California.
Palabras clave: Región mediterránea; Linajes mitocondriales; Genoma mitocondrial; Secuenciación de próxima generación; Especies no modelo
Introduction
The Golden Eagle, Aquila chrysaetos, is an accipitrid of boreal distribution that inhabits a variety of open and semi-open biotopes from sea level to 3,630 m in altitude in biomes as tundra, chaparral, temperate grassland, temperate deciduous forest, and coniferous forest (De León-Girón et al., 2016; Flesch et al., 2020; Kochert et al., 2002; Watson et al., 2011). This emblematic species is known to occur in Mexico in the arid and semiarid environments of the northern and central regions, including some locations as south as Oaxaca (Bolger et al., 2014; De León-Girón et al., 2016; Howell & Webb, 1995; Rodríguez-Estrella, 2002; Rodríguez-Estrella et al., 1991, 2020). Although the demography of the Golden Eagle has been determined with different genetic methods that confirm the structuring of its populations (Craig et al., 2016; Doyle et al., 2016), little is known about the genetic identity of populations of this eagle in its distribution range. Northwestern Baja California is considered the greatest nesting and conservation potential region for the Golden Eagle in Mexico (De León-Girón et al., 2016; Rodríguez-Estrella, 2002; Rodríguez-Estrella et al., 1991; Tracey et al., 2017), with vast areas of habitats still pristine for the population conservation of this species shared with the United States of America (Craig et al., 2016; De León-Girón et al., 2016, 2024; Doyle et al., 2014; Katzner et al., 2023).
Studies based on mitochondrial DNA (mtDNA) allow determining the current state of conservation of species, as well as the identification of significant evolutionary and management units with their demographic aspects (Moritz, 1994). With the advent of next-generation sequencing (NGS) technologies (especially on complete mitochondrial genomes), new studies with non-model species became more common. As was the case for various species of the family Accipitridae, including the Golden Eagle. Doyle et al. (2014) were the first to describe the nuclear and mitochondrial genome of the Golden Eagle from the central California region, in the USA.
In this study we focus on the synteny of mitochondrial genes, the phylogenetic relationships, and the mitochondrial genetic diversity among Golden Eagle individuals in northwestern Baja California, Mexico. Given the high migration potential of this species, individuals collected in northwestern Baja California are predicted to be phylogenetically related to the westernmost Golden Eagle population in the USA. Therefore, studies focused on examining the genetic variation at the mitochondrial level will allow better decision-making for management and conservation programs for the species in a binational spectrum. In the same way, our study will be a valuable reference for analyzing other Golden Eagle populations in Mexico and other regions of its distribution range.
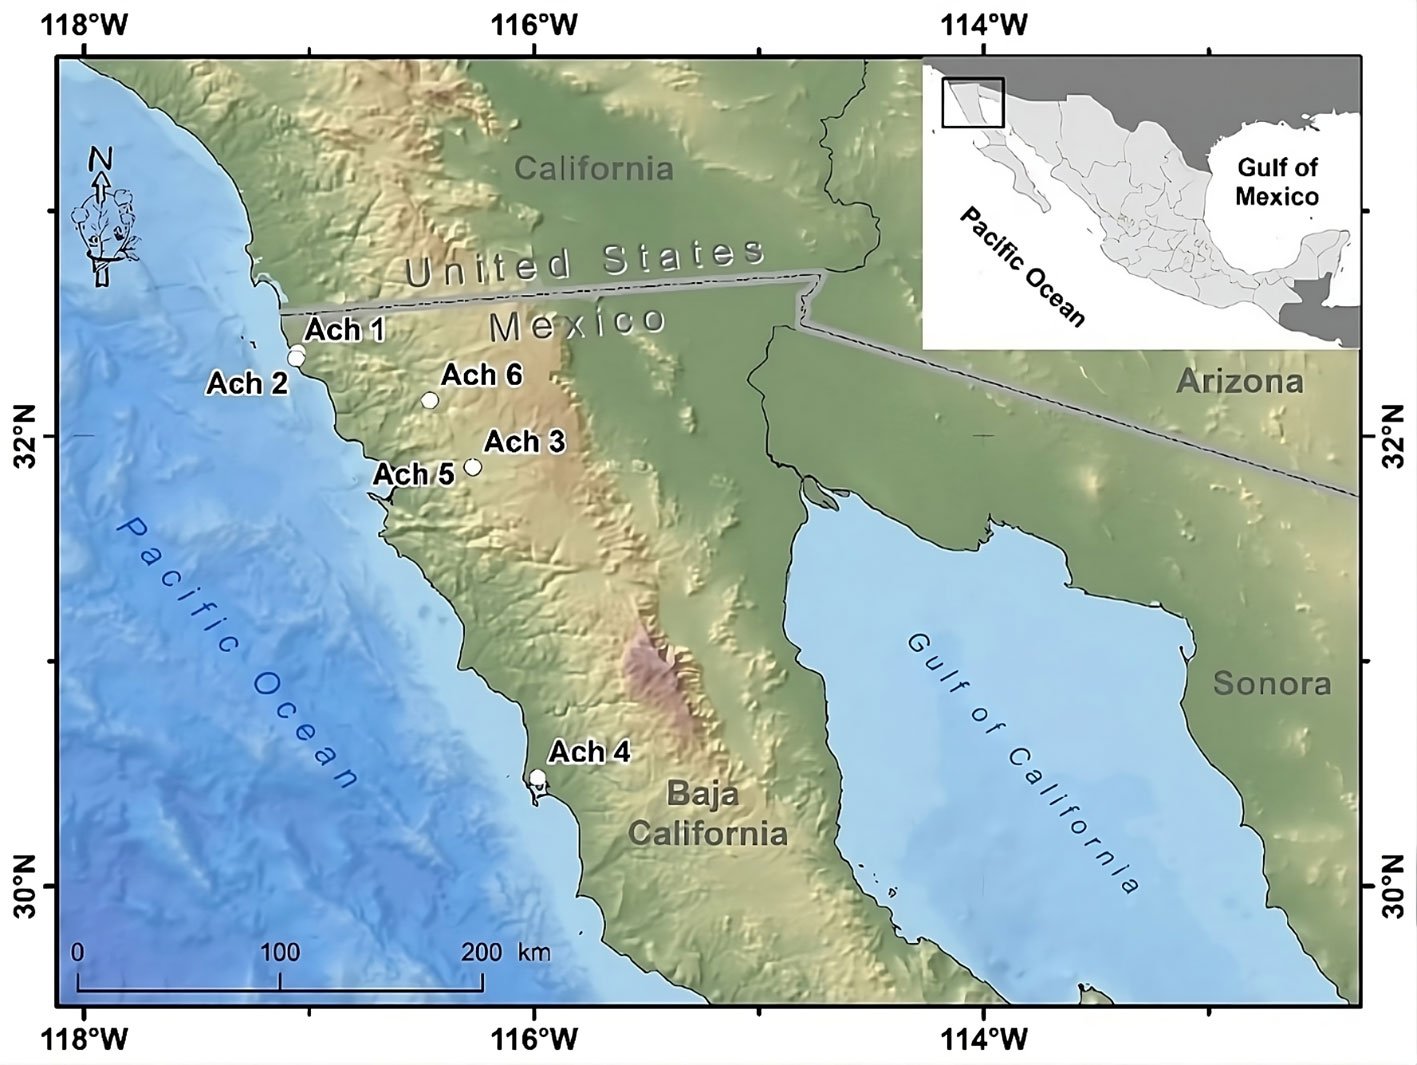
Figure 1. Geographical location of the Golden Eagle voucher specimens examined for mitogenome in the northwestern Baja California, Mexico. Geographic coordinates for each individual can be found in Supplementary material T1. Map by Rafael Hernández Guzmán.
Materials and methods
Tissue samples of 6 Golden Eagle specimens from northwestern Baja California, Mexico were obtained. These specimens were found dead in different agriculture valleys of the Mediterranean region in northwestern Baja California, Mexico, between the municipalities of Rosarito and San Quintín, from 1995 to 2014, and deposited as vouchers in the Bird Collection of the Science Faculty, at the Autonomous University of Baja California (UABC), campus Ensenada (Fig. 1, Supplementary material: T1).
For the DNA extraction, tissue samples of the pads of the feet of 5 Golden Eagle specimens referred to here as Ach 1 to Ach 5 were obtained. DNA using the nucleic acid purification method by differential saline precipitation (Aljanabi & Martinez, 1997) was extracted. Both feathers and blood for the Ach 6 sample (Supplementary material: T1) were used and extracted DNA with the Qiagen Blood & Tissue kit. The quality and quantity of the extracted DNA in both cases was evaluated using Nanodrop, Qubit and agarose gel electrophoresis.
Extracted DNA (from 77 to 210 ng/µL per sample quantified in Nanodrop for Ach1-Ach5 individuals and 0.581 ng/µL for Ach6 quantified in Qubit) was purified with SpeedBeads magnetic beads (Thermo-Scientific, Waltham, MA, USA) at a 1.2:1 beads:DNA ratio and resuspended in 50 µl of TLE1X buffer. Libraries for shotgun sequencing were prepared, for which purified DNA from each individual was fragmented by sonication in a Bioruptor® (Diagenode, Liege, Belgium) using 2 rounds, each consisting of 5 cycles of 30 sec of sonication and 30 sec without sonication at the highest setting. DNA fragments were then prepared using the Kapa Biosystems® Hyper Prep Kit (KR0961–v4.15, Roche, Basel, Switzerland), with which end repair and A-tailing were performed, adapters were ligated, and PCR was performed with indexed primers (Glenn et al., 2020) for 14 cycles. Following amplification, fragment size selection was performed by double-dip with SpeedBeads magnetic beads (Thermo-Scientific, Waltham, MA, USA) that allow to preserve fragments between ~250 and ~700 base pairs (bp) for each of the samples, which are the appropriate insert size for the Illumina platform. Sequencing was performed paired end on 2 different platforms. We sequenced the Ach1-Ach5 samples on the Illumina MiSeq V.3 at the Georgia Genomics and Bioinformatics Core (GGBC) to generate 300-bp paired-end fragments, and we sequenced Ach6 on an Illumina HiSeq 4000 at the Oklahoma Medical Research Foundation Clinical Genomics Center to generate 150-bp paired-end fragments.
Bioinformatic analysis. The quality of the raw sequences was evaluated using the FastQC program (Andrews, 2010). Subsequently, the sequences using a standard treatment were filtered using the Trimmomatic software (Bolger et al., 2014) with 4 steps. In the first step, the sequencing adapters and over-represented sequences were removed by means of the ILLUMINACLIP function. The second step discarded sequences with a quality value below 30 QS with the AVGQUAL function. The third step removed fragments below 25 QS with the SLIDINGWINDOW function. The fourth step did an even stricter cleanup using MAXINFO. This step conserved sequences of at least 100 base pairs and was configured to preferentially conserve longer sequences with a value of 0.3. For the Ach 5 specimen, an extended and modified version of the standard treatment was used due to the low quality of sequences. This involved applying the SLIDINGWINDOW function, which modifies the quality value.
Assembly and annotation. Two strategies were followed to assemble the mitochondrial genomes: the reference based and the de novo strategy (Machado et al., 2015, 2018). Mapping against a reference mtDNA genome was performed using the Bowtie2 program version 2.3.4.2 with clean reads (Langmead & Salzberg, 2012). The reference mitochondrial genome was from the same species A. chrysaetos, with the GenBank accession number of KF905228.1. De novo assembly only for samples Ach 2 to Ach 6 was performed using the A5-miseq pipeline (Coil et al., 2015). Due to the large number of reads after the filter (Supplementary material: T2) sample Ach 1 was analyzed with the Velvet software version 1.1 (Zerbino & Birney, 2008). The mitogenome was annotated from the scaffolds obtained from the de novo assemblies. We determined scaffolds longer than 4 Kpb by applying a search with the BLAST tool (Basic Local Alignment Search Tool) of the NCBI (National Center for Biotechnology Information) website. The scaffolds were aligned to achieve greater coverage considering the length of the reference genome used previously. Afterwards, RNAweasel (http://megasun.bch.umontreal.ca/RNAweasel/) was implemented to the identification of tRNA’s (transfer RNA), rRNA’s (ribosomal RNA) and introns and, in turn, MFannot (http://megasun.bch.umontreal.ca/RNAweasel/) for the identification of proteins and open reading frames (Sieber et al., 2018).
In addition to the previous annotation, MITOS web server (Bernt et al., 2013) was used to assist in the annotation of de novo mitochondrial genomes, allowing gene names, tRNA and rRNA secondary structures, and codon usage to be obtained. Finally, a manual curation of the annotations was used to review the 6 existing reading frames with the UGENE software (Okonechnikov et al., 2012). The control region was identified based on 99% similarity with an A. chrysaetos partial control region sequence (EF459579.1). Genome Vx software (Conant and Wolfe, 2008) was used to map the Golden Eagle’s mitogenome, using individual Ach 6 to achieve this analysis.
In the annotation of the de novo assembly, the ND3 protein appeared divided into 2 fractions (see Results), a trait that was not reported by Doyle et al. (2014). Therefore, an experimental verification was required through PCR amplification and its subsequent Sanger sequencing. We designed primers from de novo assembly using the NCBI Primer-BLAST program: ND3Ach-1 (5’GCCTGATACTGGCACTTCGT3’ and 5’CCCTATCAATCTGACCCACCG3’) which generates a 716 bp fragment and ND3Ach-2 (5’CTTCTTCGTCGCTACAGGCT3’ and 5’CCTTCCACCGAACCCACTTAA3’) which generates a 774 bp fragment. Eight Golden Eagle samples from the Ornithological Collection of the Faculty of Sciences of the Autonomous University of Baja California were used for PCR amplification. These samples correspond to the 6 individuals used for sequencing and 2 extra samples that are not part of the mitogenome assembly study. The conditions of the PCR reaction were as follows: 6 min at 94°C, 35 cycles of denaturation, annealing, and extension at 94°C for 30 sec, 51°C for 30 sec and at 72°C for 1.5 min, respectively. A final elongation stage at 70°C for 7 min, and a final conservation stage at 15°C. We sent the amplified fragments for sequencing to the SeqXcel.inc Company in San Diego, California, and analyzed with the ABI PRISM® 3130xl Genetic Analyzer DNA kit.
Synteny and search for polymorphisms. A posteriori synteny analysis was performed between the Golden Eagle mitogenome reported by Doyle et al. (2014) and the newly assembled mitochondrial genome of this study. This analysis was carried out with the MAUVE software (Darling et al., 2004). The same reference mitogenome was used to call SNP’s and INDEL’s for the 6 genomes assembled in this work using the SAMtools program (Li, 2011). Filtering the call quality of the variants involved discarding those with a value less than 20 Qs and keeping those with at least 5X depth (Li, 2011). Each variant was manually evaluated, retaining SNPs and INDELs where at least half of the aligned reads showed the change and verified its existence in at least one other individual (Fridjonsson et al., 2011).
Phylogenetic relationships. Phylogenetic relationships were inferred using the individual gene dataset and the mitogenome. The individual gene fragments analyzed consisted of the ND2, ND3, coxI and Cytb recovered from Aquila chrysaetos individuals from GenBank (Supplementary material: T3) and those produced in this study. The mitogenome analysis for phylogenetic relationships consisted of 10 complete mitogenomes: 6 obtained in this study, 2 reference samples of Aquila chrysaetos (LR822062 from the United Kingdom and NC_024087.1 from California, USA), 1 reference sample classified as Aquila heliaca (NC_035806.1), but has been reported to actually consist of a A. chrsyasetos individual (Sangster & Lukesenburg, 2021) and 1 outgroup (Aquila nipalensis, GenBank accession number NC_045042.1). Both datasets were aligned using the MAFFT 7 algorithm (Katoh & Standley, 2013). Removing the non-conserved regions between the sequences of the multiple alignments was done using the online program Gblocks with the default parameters (Castresana, 2000). The nucleotide substitution model and the mutation rate were determined using JModelTest (Posada, 2008), considering the Bayesian information criterion (BIC).
Two phylogenetic reconstruction methods were used: Maximum Likelihood (ML) and Bayesian analysis. In IQ-TREE (Nguyen et al., 2015) the ML method (Felsenstein, 1981) was run with the DNA substitution model selected by ModelFinder (Kalyaanamoorthy et al., 2017) and 1,000 bootstrap pseudo replicates were performed (Hoang et al., 2017). Bayesian inference was used with MrBayes program (Ronquist et al., 2012); for this, 4 Markov Monte Carlo chains (MCMC) were implemented with a total of 10 million generations, and a sampling every 1,000 generations. To construct the consensus phylogenetic tree, a 25% of burn-in was applied. The support of the nodes was evaluated via the posterior probability values. The results of both approaches were visualized with FigTree 1.4 (Rambaut, 2009). For the mitogenome phylogenetic tree, the dataset on genes that were annotated across the entire mitogenome were partitioned (Supplementary material: T4). To determine the most appropriate DNA substitution model for each gene, the Akaike Information Criterion test implemented in jModelTest2 (Darriba et al., 2012; Guindon & Gascuel, 2003) was used (see selected models for each gene in Supplementary material: T4). The partitioned mitogenome dataset was used to estimate a Bayesian phylogenetic tree in MrBayes (Ronquist et al., 2012). The Bayesian analysis was carried out by running 4 MCMC chains for 5 million generations and saving the trees every 1,000 generations. The consensus phylogenetic tree was constructed using a 10% burn-in.
Genetic diversity. Individual DNA segments from the coxI, Cytb, ND2, and -ND3 genes were used to estimate the genetic diversity parameters for the A. chrysaetos species complex since these were the genes that had a relative amount of A. chrysaetos DNA sequences available in GenBank. Using DNA sequences from the Baja California individuals produced in this study and reference sequences from the species complex (Supplementary material: T3) the following indices were estimated with DnaSP 6 (Rozas et al., 2017): the number of segregating sites (S), number of haplotypes (Nh), haplotype diversity (Hd), and nucleotide diversity (π). Genetic diversity indices were calculated among all sequences included in the respective datasets and within specific groups of sequences according to phylogenetic clades or geographic origin of samples. In addition, the genetic distance (uncorrected p-distance) between and within the phylogenetic clades observed within the mitochondrial genetic lineages in PAUP software was estimated (Swofford, 1993). The clade OTU1 included sequences from a diverse geographical background, including all the DNA sequences of the Baja California golden eagles. In contrast, the A. chrysaetos DNA sequences grouped in the other closely related clade were classified as OTU2. Additionally, the DNA sequence of an individual of A. chrysaetos from California (Southern Sierra Nevada) was analyzed separately to compare its genetic distance with those from Baja California, given the geographical proximity between both populations.
Results
Raw sequencing reads ranged from 3,324,579 (individual Ach 1) to 539,825 (individual Ach 4). The number of total sequences after the filter ranged between 3,251,746 (Ach 1) and 526,875 (Ach4) (Supplementary material: T2A).
Assembly and annotation. There were large differences in assembly between individuals; for example, the average depth in the reference mapping for individual Ach 1 is 30.5X, while for Ach 6 is 168.3X, even though Ach 6 had fewer total reads than Ach 1. Assemblies for individuals Ach 1-5 showed fewer aligned sequences (Supplementary material: T2A). For de novo assembly, the average depth for individual Ach 6 is 8.0X. The longest scaffold generated (17,472 bp) allowed us to assemble the entire mitogenome of the Ach 6 individual, eliminating the need to align multiple scaffolds to recover the full length (Supplementary material: T2B). The data yield was inferior when doing de novo assembly for Ach 1-5 individuals, and none of these individuals allowed the recovery of the complete mitochondrial genome (Supplementary material: T3B).
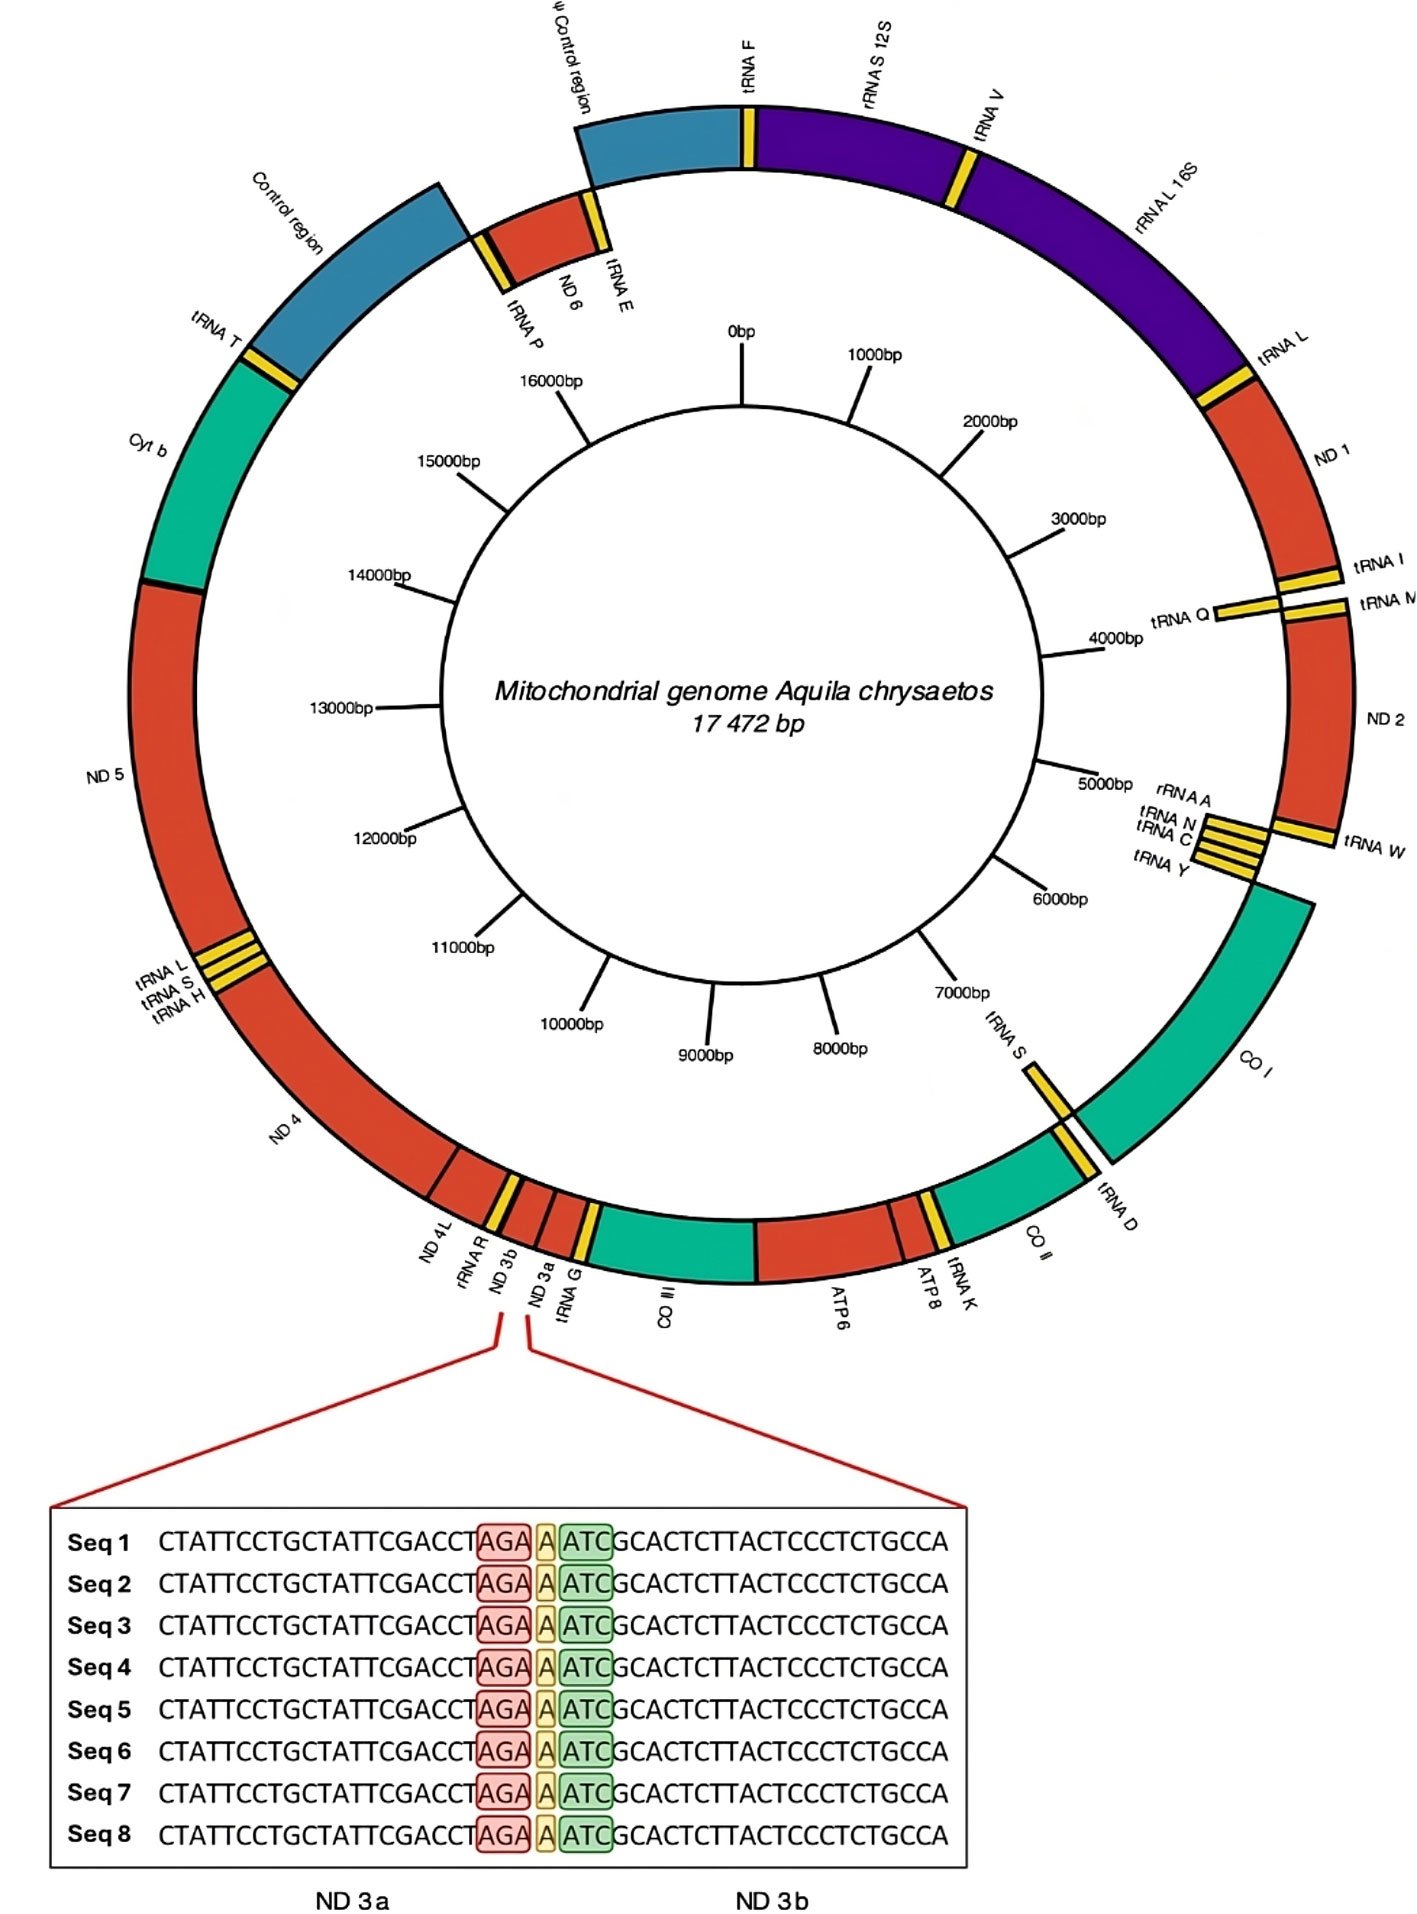
Figure 2. Mitogenome annotated by de novo assembly for Golden Eagle (Ach6) from Baja California, Mexico. In the central part of the diagram in a ring form is shown a scale of the length of mitochondrial genome clockwise. Enlarged view of the section showing the division into 2 fractions of the mitochondrial gene for NADH dehydrogenase subunit 3 (ND3). The stop codon of the ND3a fraction is highlighted in red, the insertion of nucleotide A in yellow, and the start codon of the ND3b fraction in green. The ND3 gene is composed entirely of 352 bp; the ND3a fraction is 207 bp long, while the ND3b fraction is 144 bp long.
Based on the above results, we annotated and curated the mitochondrial genome using only the complete mitogenome obtained by de novo assembly of the Ach 6 individual. All 3 annotation tools identified tRNAs, and none of the tools identified introns within the sequence. The MITOS program (Fig. 2, Supplementary material: T4) was the only software that identified all the genetic elements, such as the 22 tRNAs, 2 rRNAs, and the 13 protein-coding genes that make up the mitogenome. This last annotation was the most complete, so the curation was made from it. We found a region with 7 nucleotide bases that is composed of an AGA stop codon of the ND3 protein, followed by an adenine (A) and finally an ATC start codon that codes for isoleucine. This region divides the ND3 fragment into the 2 regions proposed here (ND3a and ND3b, Fig. 2).
Synteny and search for polymorphisms. The linear order of the mitogenome of Ach 6 coincides with the reference genome (Accession number MT319112.1, Supplementary material: T5). We consider the SNPs and INDELs identified in the Ach 6 reliable, given that the average coverage is 168.3X, and their call quality was high (Supplementary material: T2A). Most SNPs and INDELs are found within genes that code for some protein, transfer RNA and ribosomal genes. The coxI gene presented the greatest number of SNPs with respect to the reference genome in the 6 individuals, while the Cytb and tRNA F genes presented the greatest length changes in the INDELs. In addition, in the ND3 gene, there is a consistent change in the sequences of the 6 individuals with respect to the reference genome (Table 1).
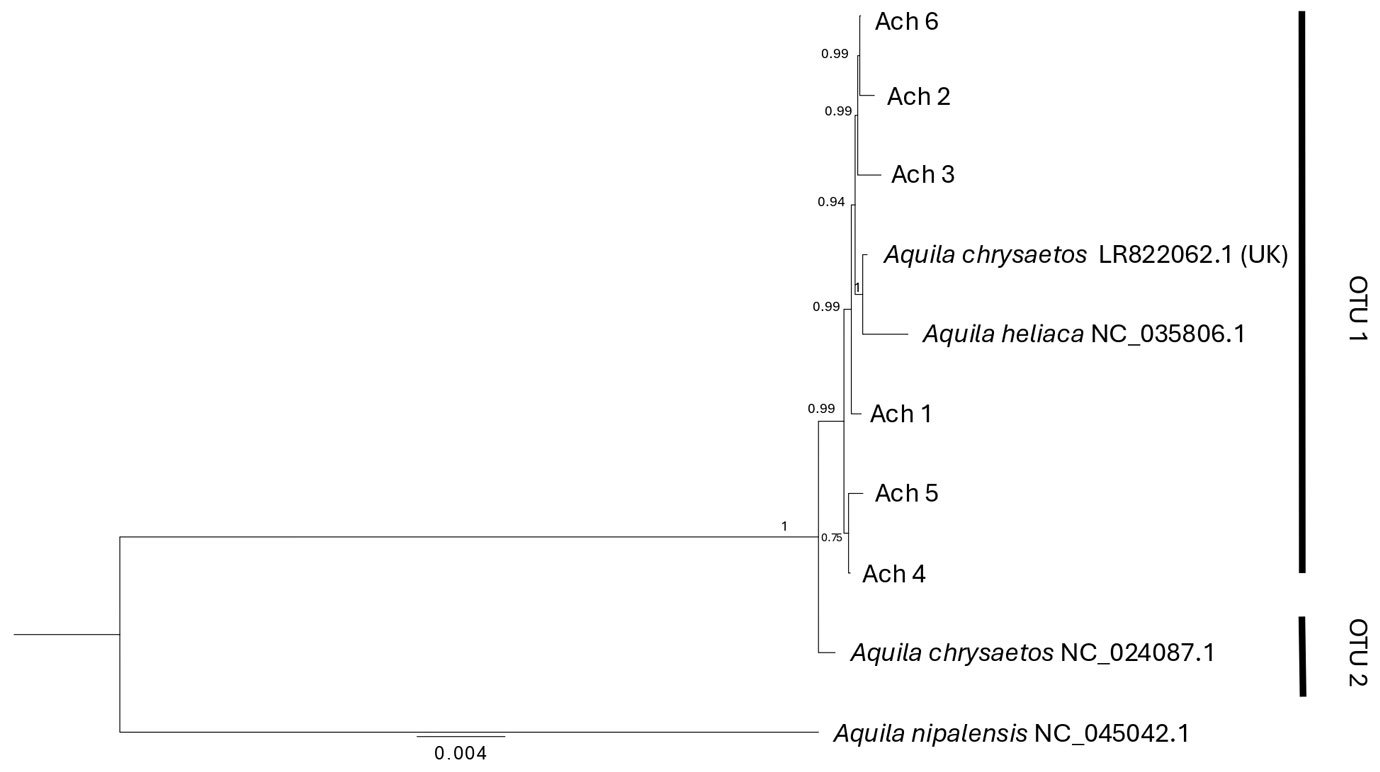
Figure 3. Bayesian phylogenetic tree based on the mitogenome for Golden Eagle voucher specimens from northwestern Baja California, Mexico. Posterior probabilities are shown above internal nodes. GenBank accession numbers are positioned next to reference sequences. Aquila nipalensis was used as an outgroup for rooting the tree. Two Operational Taxonomic Units are identified (OTU 1, 2).
Phylogenetic relationships. With the use of the mitogenome we constructed a phylogenetic tree that identified 2 clades with strong support (1): OTU1 that includes all the individuals analyzed in this study, plus 2 GenBank sequences (Aquila chryseatos, LR82062.1 from the United Kingdom and A. heliatica, NC_035806.1), and OTU2 that corresponds to a GenBank sequence of a specimen collected in California (Fig. 3). For their part, the phylogenetic trees obtained with the fragments of individual genes (ND2, ND3, Cytb and coxI) did not resolve the divergence between individuals from Baja California and California obtained with the mitogenome, but all except the ND3 gene showed a divergence (OTUs 1 and 2), mainly with respect to eagles from the European continent (when information on the collection location is reported, Supplementary material: F1).
Genetic diversity. We observed low genetic diversity, for instance, ND3, ND2, and coxI each had a single segregating site (Table 2), resulting in low nucleotide diversity values (0.0005, 0.0008, and 0.0002, respectively). In contrast, Cytb was the most polymorphic, with a total of 10 segregating sites and a nucleotide diversity an order of magnitude larger (0.00297) (Table 2). The genetic diversity found within OTU1 was higher than that found in OTU2 (Table 2), although OTU1 was not a geographically homogeneous clade among the trees of the different mitochondrial genes, for example in the case of ND2 it was made up of North American eagles, including the individuals of this study, but coxI apart from the previous ones was constituted with eagles from Sweden, Norway and Japan (Table 2).
Discussion
Despite using 2 sequencing platforms for the mitogenome of Golden Eagle from northwestern Baja California, Mexico, we successfully assembled the mitochondrial genome of all 6 individuals by the reference method. This included some individuals (Ach 1-5) with non-consensus regions. Bolger et al. (2014) recommend a pre-processing step of the readings before any analysis, be it assembly by reference or de novo, and mention that if the library and identification adapters are not removed, they can be incorporated in the final assembly. In our case, the pre-processing of the sequences positively influenced the performance of both assemblies and the SNP’s call since the quality of the sequence of the 6 individuals was considerably improved after pre-processing in all aspects of quality reporting.
Table 1
Location of SNP’s and INDEL’s in mitogenomes. Call of SNP’s and INDEL’s for each the Ach 1-6 specimens versus the reference genome of Golden Eagle from the southern Sierra Nevada in California, USA (GenBank accession: KF905228). Pos: Mitogenome position; Ref: nucleotide present in reference sequence. ψCR: Mitochondrial pseudogene control region.
| Pos. | Ref. | Ach1 | Ach2 | Ach3 | Ach4 | Ach5 | Ach6 | Gen |
| SNP’s | ||||||||
| 1,505 | G | A | A | A | ||||
| D-loop | ||||||||
| 1,515 | T | C | ||||||
| 3,130 | G | A | A | A | ||||
| 3,566 | A | G | ND6 | |||||
| 3,695 | T | A | A | A | ||||
| 3,696 | T | A | A | A | ||||
| 5,557 | G | A | A | A | A | A | LSU rRNA | |
| 6,646 | G | A | A | A | ND1 | |||
| 7,141 | A | G | ||||||
| 8,269 | C | T | A | T | ND2 | |||
| 8,593 | A | G | G | A | G | |||
| 8,723 | G | A | A | A | A | tRNA-Trp | ||
| 10,925 | C | T | T | T | T | T | ||
| 10,963 | T | C | ||||||
| 10,970 | C | T | T | T | T | T | ||
| 10,975 | T | C | coxII | |||||
| 11,003 | A | G | G | |||||
| 11,011 | C | T | ||||||
| 11,205 | A | G | ||||||
| 11,213 | C | T | ||||||
| 11,237 | C | T | ||||||
| 11,282 | G | A | ||||||
| 11,284 | G | T | ||||||
| 11,285 | A | C | ||||||
| 11,351 | T | C | ||||||
| 11,354 | A | G | ||||||
| 11,378 | C | T | T | |||||
| 11,432 | C | T | T | T | T | T | ||
| 11,489 | A | C | C | C | C | C | C | |
| 11,493 | T | T | tRNA-Lys | |||||
| 11,496 | G | A | ||||||
| 11,505 | T | G | ||||||
| 17,278 | G | A | A | ND5 | ||||
| INDEL’s | ||||||||
| Table 1. Continued | ||||||||
| Pos. | Ref. | Ach1 | Ach2 | Ach3 | Ach4 | Ach5 | Ach6 | Gen |
| 3 | CTAA | CTAA CTTC CAAA CTAA | Cyt b | |||||
3,550 | T | TGTG AACA A | ψCR | |||||
| 3,701 | CAAA | CCCA CCAA TA | CCAA CAAT AT | tRNA-Phe | ||||
| 13,378 | T | TC | TC | TC | TC | TC | TC | ND3 |
Table 2
Genetic diversity and haplotype composition from gene segments. Tax Set: Group of sequences included in taxonomic set; N: number of sequences; bp: base pairs of DNA sequence included in alignment; S: number of segregating sites; Nh: number of haplotypes; Hd: haplotype diversity; Nd: nucleotide diversity; North America: sequences from either Canada or USA. All sequences from ND3 formed a single clade, and thus were analyzed as a single group. OTUs 1 and 2 in each individual gene refer to the clades detected in each phylogenetic analysis, see Supplementary material F1.
| Mitochondrial sequence | Tax Set | N | bp | S | Nh | Hd | Nd |
| ND3 | All | 11 | 352 | 1 | 2 | 0.182 | 0.00053 |
ND2 | OTU1 | 8 | 1,039 | 0 | 1 | 0 | 0 |
| OTU2 | 4 | 1,039 | 0 | 1 | 0 | 0 | |
| North America | 2 | 1,039 | 0 | 1 | 0 | 0 | |
| Europe | 3 | 1,039 | 0 | 1 | 0 | 0 | |
| All | 12 | 1,039 | 1 | 2 | 0.485 | 0.00087 | |
coxI | OTU1 | 13 | 1,551 | 1 | 2 | 0.154 | 0.00025 |
| OTU2 | 2 | 1,551 | 0 | 1 | 0 | 0 | |
| North America | 4 | 1,551 | 0 | 1 | 0 | 0 | |
| Europe | 4 | 1,551 | 1 | 2 | 0.5 | 0.00082 | |
| All | 15 | 1,551 | 1 | 2 | 0.133 | 0.00022 | |
Cytb | OTU1 | 13 | 1,143 | 1 | 2 | 0.154 | 0.00016 |
| OTU2 | 3 | 1,143 | 1 | 2 | 0.667 | 0.00069 | |
| North America | 4 | 1,143 | 1 | 2 | 0.5 | 0.00052 | |
| Europe | 5 | 1,143 | 9 | 3 | 0.02688 | 0.00541 | |
| All | 16 | 1,143 | 10 | 4 | 0.442 | 0.00297 |
The most reliable mitogenome assembly was that of Ach 6 individual due to its higher alignment rate, its greater depth, and its 100% coverage of the reference genome. This ensemble can be considered true and not an artifact due to the procedures used, such as sampling every 500 generations and a burn-in value of 600,000 generations (Lerner & Mindell, 2005). In addition, we analyzed the data with Bowtie2, which implements an alignment strategy based on the FM-Index and Burrows-Wheeler. These programs have been shown to work well for applications such as INDEL discovery (Lindner & Friedel, 2012) and for aligning long sections of the reference genome (Thankaswamy-Kosalai et al., 2017). Hunt et al. (2014) pointed out that the best result of assembling a genome de novo is when it is contained in a single scaffold for the entire mitochondrial DNA molecule or for each chromosome in the case of the nuclear genome. The Golden Eagle mitochondrial genome assembly of individual Ach 6 was the best because it was found within a single scaffold (17,472 bp) and its depth was at least 8.0X (Supplementary material: T2B; Baker, 2012).
The extension and position of the genes in the mitogenome of the Golden Eagle described in this study (Fig. 2, Supplementary material: T4) showed differences compared to those reported by Doyle et al. (2014) from an individual sampled in central California. For example, the size of the mitogenome described here is larger (17,472 bp) than the one reported by Doyle et al. (2014) (17,332 bp), with a difference of 140 bp. When experimentally analyzing the size of the ND3 gene amplified fragments, the size was between 700 and 800 bp, that is, the theoretically expected size. Another difference consisted in the fraction of the gene encoding the ND3 protein reported here as split into 2 segments (ND3a and ND3b). The distinction of the 2 subunits is, within the reading frame, a region made up of 7 nucleotides between the ATC start codon that starts the protein, and the TAA stop codon that marks the end of the protein. The first 3 of these 7, code for a new AGA stop codon, followed by an adenine (A) nucleotide and 3 nucleotides that code for a new ATC start codon. This causes 2 coding portions to coexist, annotated as ND3, separated by a single nucleotide that changes the reading frame, causing the second portion to appear with its start and stop codons. Mindell et al. (1998) report a nucleotide that is not translated within the ND3 protein sequence. Eberhard and Wright (2016) mentioned that such a trait is observed in the entire order Psittaciformes (parrots, parakeets, and allies).
Specifically, a variety of distinct indels have been found within several of the mitochondrial protein-coding genes in Psittaciformes (Eberhard & Wright, 2016), with variations in terms of their evolutionary origin since some are present in all Psittaciformes and some are more recent in origin and only found within specific taxa. Slack et al. (2003) reported variation in the length of the mitochondrial ND6 gene in other avian taxa. Overall, the biological implications of these variations remain unclear until more studies on the proteins are performed to determine if the protein compositions become altered by these variations. However, the experimental verification carried out in the present study strengthens our annotation as 2 fractions for the ND3 region of the A. chrysaetos mitogenome. Also, we noted the regulatory non-coding region (the pseudo control region, ψCR) to be highly conserved among the A. chrysaetos individuals analyzed, which is a relatively conserved region within the order Accipitriformes (cf. Song et al., 2015) and is also found in the same position between the tRNA -E and tRNA-F, as shown by Liu et al. (2017) for the mitogenome of Accipiter gularis, another congeneric species.
Synteny and search for polymorphisms. The assembled Golden Eagle mitogenome did not present changes in gene order with respect to the reference (KF905228.1, a male Golden Eagle from southern Sierra Nevada, California). As expected, neither did it present changes in the order of the genes with respect to other species of the same group of birds (Accipitridae), such as Buteo buteo (Haring et al., 2001), Accipiter virgatus (Song et al., 2015), Aquila fasciata (Jiang et al., 2015) and Accipiter gularis (Liu et al., 2017). In addition, it is consistent with one of the general models of the birds’ mitogenome that is characterized by a duplication of the control region and other adjacent genes, which were subsequently degraded, giving rise to the ψCR (Eberhard & Wright, 2016). SNP’s and INDEL’s observed in the mitogenome of the Ach 6 individual meet the needed quality (probability of not being an error) and sequence depth (Li, 2011), so they can be considered as potential markers that should be tested in future population studies, considering some technical aspects, and thus avoid the call of false positives (The 1000 Genomes Project Consortium, 2015).
Reconstruction of phylogenetic relationships. The phylogenetic tree classified all Golden Eagle individuals into 2 mitogenome clades (OTU1 and OTU2). All individuals from Baja California, an individual from the United Kingdom, and an A. heliaca individual clustered within OTU1 (Fig. 3), while OTU2 was composed of a single Golden Eagle individual from California. The genetic distance between the 2 OTUs was 0.002 nucleotide differences per site (Supplementary material: T6). This pattern is not surprising given the poor sampling of taxa for both the mitogenomes and individual genes of A. chrysaetos. Once additional mitogenomes are available for this species, it will become possible to increase the phylogenetic resolution that could confirm or reject the potential presence of multiple mitochondrial lineages circulating within Golden Eagle populations. Nevertheless, given the broad geographic area included in the mitogenome dataset (i.e., an A. chrysaetos individual from the United Kingdom, as well an A. heliaca individual), and the low genetic diversity observed within these mitochondrial sequences (see below), suggests that at the mitochondrial level, the genetic diversity found within A. chrysaetos populations is low.
The use of genes or fragments of the mitochondrial genome allows for the analysis to include a larger data set in the number of locations and individuals. The topology of 3 of the 4 individual gene trees (ND2, Cytb and coxI) did support the presence of at least 2 mitochondrial clades (Supplementary material: F1). However, these gene trees were not consistent when grouping the North American Golden Eagle individuals on the same OTUs.
Future studies targeting molecular markers with a higher mutational rate (i.e., microsatellites) or genomics approach could potentially uncover the presence of genetic differences that are not well defined at the mitochondrial level but might be biologically important. One such difference is seen in the species’ bivalent behavior and its migration pattern in the west (Mcintyre & Lewis, 2016) and northwest of the USA, and through Canada (Bedrosian et al., 2018). The mitogenomic lineages that potentially infer the difference between the eagles of Baja California and central California could correspond to the area where 2 ecological populations are coexisting (De León-Girón et al., 2016). The first population is migratory, originating in western North America (Oregon), while the second lineage is resident in Baja California. According to Craig et al. (2016), this lineage has 1 of the less frequent haplotypes of the mitochondrial control region and is restricted to California. The ability of the Golden Eagle to adapt to different environments (Judkins & Van Den Bussche, 2018), the large dispersal distances of reproductive or floating between Mexico and the USA (De León-Girón et al., 2016, 2024; Rodríguez-Estrella et al., 2020; Tracey et al., 2017), and its extensive home range of reproductive pairs (D’Addario et al., 2019), would support these hypotheses. Besides, the presence of these groups of individuals (reproductive and non-reproductive) in Baja California would be part of the reproductive behavior of the species (Watson et al., 2011), that is, the process of succession and substitution of reproductive pairs in the region (De León-Girón et al., 2016).
Genetic diversity. The values of mitochondrial genetic diversity calculated for most genes (except Cytb) were near zero (Table 2). We expected this result, considering that they are genes that code for proteins with highly conserved regions (Dawnay et al., 2007) and are subject to biochemical limitations that cause high levels of homoplasy (Faria et al., 2007). However, Bates et al. (2003) mentioned that ND2 is genetically more diverse than Cytb, while Faria et al. (2007) stated that ND2 is one of the most variable mitochondrial genes within birds and, therefore, regularly implemented in population genetics. A pattern we did not observe in A. chrysaetos since Cytb was the gene with the highest genetic diversity observed, with a haplotype diversity of 0.154 and 0.667 for OTU1 and OTU2, respectively, while both OTUs had a haplotype diversity of zero for the ND2 gene (Table 2).
Implications for conservation. Golden eagles are recognized for presenting large expanses of territory, and their resident, migratory and floating populations (reproductive adults without territories), promote the population gene flow (Craig et al., 2016; Poessel et al., 2022). The mitochondrial DNA data produced in this study confirm a very close genetic relationship between the northwestern Baja California individuals and those from the USA. Therefore, the execution of bi-national conservation programs by the agencies of both countries (SEMARNAT and USFWS) are priorities for the “Californian-Baja Californian” metapopulation of Golden Eagle. It is necessary to increase the number of young individuals with satellite tracking in the southern Baja California peninsula, to continue the genetic characterization (with different types of markers, mitochondrial DNA, microsatellites and SNPs obtained by Next Generation Sequencing) and population monitoring to evaluate the structure and connectivity of the species in both countries.
Our findings warrant developing joint conservation efforts between the governments of Mexico and the USA to monitor and preserve the North American Golden Eagle.
Acknowledgements
Funding for the sequencing was covered by the SAGARPA-INAPESCA PIDETEC project 2017/0647. The authors thank Travis Glen and Natalia Juliana Bayona Vásquez for their Illumina sequencing services. We thank 3 anonymous reviewers who helped improve the manuscript.
References
Aljanabi, S. M., & Martinez, I. (1997). Universal and rapid salt-extraction of high-quality genomic DNA for PCR-based techniques. Nucleic Acids Research, 25, 4692–4693. https://doi.org/10.1093/nar/25.22.4692
Auton, A., Brooks, L. D., Durbin, R. M., Garrison, E. P., Kang, H. M., Korbel, J. O. et al. (2015). A global reference for human genetic variation. The 1000 Genomes Project Consortium. Nature, 526, 68–74. https://doi.org/10.1038/nature15393
Baker, M. (2012). De novo genome assembly: What every biologist should know. Nature Methods, 9, 333–337. https://doi.org/10.1038/nmeth.1935
Bates, J. M., Tello, J. G., & Da Silva, J. M. C. (2003). Initial assessment of genetic diversity in ten bird species of South American Cerrado. Studies on Neotropical Fauna and Environment, 38, 87–94. https://doi.org/10.1076/snfe.38.2.87.15924
Bernt, M., Donath, A., Jühling, F., Externbrink, C., Florentz, G., & Fritzsch, J. (2013). MITOS: Improved de novo metazoan mitochondrial genome annotation. Molecular Phylogenetics and Evolution, 69, 313–319. https://doi.org/10.1016/j.ympev.2012.08.023
Bolger, A. M., Lohse, M., & Usadel, B. (2014). Trimmomatic: a flexible trimmer for Illumina sequence data. Bioinformatics, 30, 2114–2120. https://doi.org/10.1093/bioinformatics/btu170
Castresana, J. (2000). Selection of conserved blocks from multiple alignments for their use in Phylogenetic Analysis. Molecular Biology and Evolution, 17, 540–552. https://doi.org/10.1093/oxfordjournals.molbev.a026334
Coil, D., Jospin, G., & Darling, A. E. (2015). A5-miseq: an updated pipeline to assemble microbial genomes from Illumina MiSeq data. Bioinformatics, 31, 587–589. https://doi.org/10.1093/bioinformatics/btu661
Conant, G. C., & Wolfe, K. H. (2008). GenomeVx: Simple web based creation of editable circular chromosome maps. Bioinformatics, 24, 861–862. https://doi.org/10.1093/bioinformatics/btm598
Craig, E. H., Adams, J. R., Waits, L. P., Fuller, M. R., & Whittington, D. M. (2016). Nuclear and mitochondrial DNA analyses of golden eagles (Aquila chrysaetos canadensis) from three areas in western North America; initial results and conservation implications. Plos One, 11, e0164248. https://doi.org/10.1371/journal.pone.0164248
D’Addario, M., Monroy-Vilchis, O., Zarco-González, M. M., & Santos-Fita, D. (2019). Potential distribution of Aquila chrysaetos in Mexico: Implications for conservation. Avian Biology Research, 12, 33–41. https://doi.org/10.1177/1758155918823424
Darling, A. C. E., Mau, B., Blattner, F. R., & Perna, N. T. (2004). Mauve: Multiple alignment of conserved genomic sequence with rearrangements. Genome Research, 14, 1394–1403. https://doi.org/10.1101/gr.2289704
Darriba, D., Taboada, G., Doallo, R., & Posada, D. (2012). jModelTest 2: more models, new heuristics and parallel computing. Nature Methods, 9, 772. https://doi.org/10.1038/nmeth.2109
Dawnay, N., Ogden, R., McEwing, R., Carvalho, G. R., & Thorpe, R. S. (2007). Validation of the barcoding gene COI for use in forensic genetic species identification. Forensic Science International, 173, 1–6. https://doi.org/10.1016/j.forsciint.2006.09.013
De León-Girón, G., Rodríguez-Estrella, R., & Ruiz-Campos, G. (2016). Estatus de distribución actual del águila real (Aquila chrysaetos) en el noroeste de Baja California, México. Revista Mexicana de Biodiversidad, 87, 1328–1335. https://doi.org/10.1016/j.rmb.2016.10.003
De León-Girón, G., Toscano, D., Ruiz-Campos, G., Porras-Peña, C., Escoto-Rodríguez, F., Sánchez-Sotomayor, V. G. et al. (2024). Aerial identification and quantification of nesting sites of Golden Eagle (Aquila chrysaetos) in the mountain ranges of central Baja California Peninsula, Mexico. Revista Mexicana de Biodiversidad, 95, e955247.https://doi.org/10.22201/ib.20078706e.2024.95.5247
Doyle, J. M., Katzner, T. E., Bloom, P. H., Ji, Y., Wijayawardena, B. K., & DeWoody, J. A. (2014). The genome sequence of a widespread apex predator, the golden eagle (Aquila chrysaetos). Plos One, 9, e95599. https://doi.org/10.1371/journal.pone.0095599
Doyle, J. M., Katzner, T. E., Roemer, G. W., Cain, J. W., Millsap, B. A., McIntyre, C. L. et al. (2016). Genetic structure and viability selection in the golden eagle (Aquila chrysaetos), a vagile raptor with a Holarctic distribution. Conservation Genetics, 17, 1307–1322. https://doi.org/10.1007/s10592-016-0863-0
Eberhard, J. R., & Wright, T. F. (2016). Rearrangement and evolution of mitochondrial genomes in parrots. Molecular Phylogenetics and Evolution, 94, 34–46. https://doi.org/10.1016/j.ympev.2015.08.011
Faria, P. J., Baus, E., Morgante, J. S., & Bruford, M. W. (2007). Challenges and prospects of population genetic studies in terns (Charadriiformes, Aves). Genetics and Molecular Biology, 30, 681–689. www.sbg.org.br
Felsenstein, J. (1981). Evolutionary trees from DNA sequences: a maximum likelihood approach. Journal of Molecular Evolution, 17, 368–376. https://doi.org/10.1007/BF01734359
Flesch, A. D., Rodríguez-Estrella, R., Gallo-Reynoso, J. P., Armenta-Méndez, L., & Montiel-Herrera, M. (2020). Distribution and habitat of the Golden Eagle (Aquila chrysaetos) in Sonora, Mexico. Revista Mexicana de Biodiversidad, 91, 1892–2019. https://doi.org/10.22201/ib.20078706e.2020.91.3056
Fridjonsson, O., Olafsson, K., Tompsett, S., Bjornsdottir, S., Consuegra, S., Knox, D. et al. (2011). Detection and mapping of mtDNA SNPs in Atlantic salmon using high throughput DNA sequencing. BMC Genomics, 12, 179. https://doi.org/10.1186/1471-2164-12-179.
Glenn, T. C., Nilsen, R. A., Kieran, T. J., Sanders, J. G., Bayona-Vásquez, N. J., Finger, J. W. et al. (2020). Adapterama I: universal stubs and primers for 384 unique dual-indexed or 147,456 combinatorially-indexed Illumina libraries (iTru & iNext). PeerJ, 7, e7755. https://doi.org/10.7717/peerj.7755
Guindon, S., & Gascuel, O. (2003). A simple, fast, and accurate algorithm to estimate large phylogenies by maximum likelihood. Systematic Biology, 52, 696–704. https://doi.org/10.1080/10635150390235520
Haring, E., Kruckenhauser, L., Gamauf, A., Riesing, M. J., & Pinsker W. (2001). the complete sequence of the mitochondrial genome of Buteo buteo (Aves, Accipitridae) indicates an early split in the phylogeny of raptors. Molecular Biology and Evolution, 18, 1892–1904. https://doi.org/10.1093/oxfordjournals.molbev.a003730
Hoang, D. T., Chernomor, O., Von Haeseler, A., Quang Minh, B., Sy Vinh, L., & Rosenberg, M. S. (2017). UFBoot2: improving the ultrafast bootstrap approximation. Molecular Biology and Evolution, 35, 518–522. https://doi.org/10.5281/zenodo.854445
Howell, S., & Webb, S. (1995). A guide of the birds of Mexico and northern Central America. Oxford, UK: Oxford University Press.
Hunt, M., Newbold, C., Berriman, M., & Otto, T. D. (2014). A comprehensive evaluation of assembly scaffolding tools. Genome Biology, 15, R42. https://doi.org/10.1186/gb-2014-15-3-r42
Jiang, L., Chen, J., Wang, P., Ren, Q., Yuan, J., Qian, C. et al. (2015). The mitochondrial genomes of Aquila fasciata and Buteo lagopus (Aves, Accipitriformes): sequence, structure and phylogenetic analyses. Plos One, 10, e0141037. https://doi.org/10.1371/journal.pone.0136297
Judkins, M. E., & Van Den Bussche, R. A. (2018). Holarctic phylogeography of golden eagles (Aquila chrysaetos) and evaluation of alternative North American management approaches. In Biological Journal of the Linnean Society, 123, 471–482. https://doi.org/10.1093/biolinnean/blx138
Kalyaanamoorthy, S., Minh, B. Q., Wong, T. K. F., Von Haeseler, A., & Jermiin L. S. (2017). ModelFinder: fast model selection for accurate phylogenetic estimates. Nature Methods, 14, 587–589. https://doi.org/10.1038/nmeth.4285
Katoh, K., & Standley, D. M. (2013). MAFFT multiple sequence alignment software Version 7: improvements in performance and usability article fast track. Molecular Biology and Evolution, 30, 772–780. https://doi.org/10.1093/molbev/mst010
Katzner, T., Kochert, M., Steenhof, K., McIntyre, C., Craig, E., & Miller, T. (2023). Golden Eagle (Aquila chrysaetos), version 2.0. InP. G. Rodewald, & B. K. Keeney (Eds.), Birds of the World. Ithaca, NY: Cornell Lab of Ornithology, USA. https://doi.org/10.2173/bow.goleag.02
Kochert, M. N., Steenhof, K., Mcintyre, C. L., & Craig, E. H. (2002). Golden Eagle (Aquila chrysaetos). In A. Poole, & F. Gill (Eds.), The birds of North America, No. 684 (pp. 1–44). Philadelphia, PA: The Birds of North America, Inc.
Langmead, B., & Salzberg, S. L. (2012). Fast gapped-read alignment with Bowtie 2. Nature Methods, 9, 357–359. https://doi.org/10.1038/nmeth.1923
Lerner, H. R. L., & Mindell, D. P. (2005). Phylogeny of eagles, Old World vultures, and other Accipitridae based on nuclear and mitochondrial DNA. Molecular Phylogenetics and Evolution, 37, 327–346. https://doi.org/10.1016/j.ympev.2005.04.010
Li, H. (2011). A statistical framework for SNP calling, mutation discovery, association mapping and population genetical parameter estimation from sequencing data. Bioinformatics, 27, 2987–2993. https://doi.org/10.1093/bioinformatics/btr509
Lindner, R., & Friedel, C. C. (2012). A comprehensive evaluation of alignment algorithms in the context of RNA-Seq. Plos One, 7,e52403. https://doi.org/10.1371/journal.pone.0052403
Liu, G., Li, C., Du, Y., & Liu X. (2017). The complete mitochondrial genome of Japanese sparrowhawk (Accipiter gularis) and the phylogenetic relationships among some predatory birds. Biochemical Systematics and Ecology, 70,116–125. https://doi.org/10.1016/j.bse.2016.11.007
Machado, D. J., Janies, D., Brouwer, C., & Grant T. (2018). A new strategy to infer circularity applied to four new complete frog mitogenomes. Ecology and Evolution, 8, 4011–4018. https://doi.org/10.1002/ece3.3918
Machado, D. J., Lyra, M. L., & Grant, T. (2016). Mitogenome assembly from genomic multiplex libraries: comparison of strategies and novel mitogenomes for five species of frogs. Molecular Ecology Resources, 16, 686–693. https://doi.org/10.1111/1755-0998.12492
McIntyre, C. L., & Lewis, S. B. (2016). Observations of migrating golden eagles (Aquila chrysaetos) in eastern interior Alaska offer insights on population size and migration monitoring. The Journal of Raptor Research, 50, 254–264. https://doi.org/10.3356/jrr-15-13.1
Mindell, D. P., Sorenson, M. D., & Dimcheff, D. E. (1998). An extra nucleotide is not translated in mitochondrial ND3 of some birds and turtles. Molecular Biology and Evolution, 15, 1568–1571. https://doi.org/10.1093/oxfordjournals.molbev.a025884
Moritz, C. (1994). Applications of mitochondrial DNA analysis in conservation: a critical review. Molecular Ecology, 3,
401–411. https://doi.org/10.1111/j.1365-294X.1994.tb00080.x
Nguyen, L. T., Schmidt, H. A., Von Haeseler, A., & Minh, B. Q. (2015). IQ-TREE: a fast and effective stochastic algorithm for estimating maximum-likelihood phylogenies. Molecular Biology and Evolution, 32, 268–274. https://doi.org/10.1093/molbev/msu300
Okonechnikov, K., Golosova, O., Fursov, M., Varlamov, A., Vaskin, Y., Efremov, I. et al. (2012). Unipro UGENE: a unified bioinformatics toolkit. Bioinformatics, 28, 1166–1167. https://doi.org/10.1093/bioinformatics/bts091
Poessel, S. A., Woodbridge, B., Smith, B. W., Murphy, R. K., Bedrosian, B. E., Bell, D. A. et al. (2022). Interpreting long-distance movements of non-migratory golden eagles: Prospecting and nomadism? Ecosphere, 13,e4072. https://doi.org/10.1002/ecs2.4072
Posada, D. (2008). jModelTest: phylogenetic model averaging. Molecular Biology and Evolution, 25,1253–1256. https://doi.org/10.1093/molbev/msn083
Rambaut, A. (2010). FigTree v1.3.1. Institute of Evolutionary Biology, University of Edinburgh, Edinburgh. http://tree.bio.ed.ac.uk/software/figtree/
Rodríguez-Estrella, R. (2002). A survey of golden eagles in Northern Mexico in 1984 and recent records in Central and Southern Baja California Peninsula. Journal of Raptor Research, 36, 3–9. https://digitalcommons.usf.edu/jrr/vol36/iss5/3
Rodríguez-Estrella, R., De León-Girón, G., Nocedal, J., Chapa, L., Scott, L., Eccardi, F. et al. (2020). Informe del Programa de monitoreo del águila real en México. Ciudad de México: Comisión Nacional para el Conocimiento y Uso de la Biodiversidad/Centro de Investigaciones Biológicas del Noroeste (CIBNOR).
Rodríguez-Estrella, R., Llinas-Gutiérrez, J., & Cancino, J. (1991). New Golden Eagle records from Baja California. Journal Raptor Research, 25, 68–71. https://digitalcommons.usf.edu/jrr/vol25/iss3/3
Ronquist, F., Teslenko, M., Van Der Mark, P., Ayres, D. L., Darling, A., Höhna, S. et al. (2012). Mrbayes 3.2: efficient bayesian phylogenetic inference and model choice across a large model space. Systematic Biology, 61, 539–542. https://doi.org/10.1093/sysbio/sys029
Rozas, J., Ferrer-Mata, A., Sánchez-Del Barrio, J. C., Guirao-Rico, S., Librado, P., Ramos-Onsins, S. E. et al. (2017). DnaSP 6: DNA sequence polymorphism analysis of large data sets. Molecular Biology and Evolution, 34, 3299–3302. https://doi.org/10.1093/molbev/msx248
Sangster, G., & Luksenburg, J. A. (2021). Sharp increase of problematic mitogenomes of birds: causes, consequences, and remedies. Genome Biology and Evolution, 13, 1–14. https://doi.org/10.1093/gbe/evab210
Sieber, P., Platzer, M., & Schuster, S. (2018). The definition of open reading frame revisited. Trends in Genetics, 34, 167–170. https://doi.org/10.1016/j.tig.2017.12.015
Slack, K. E., Janke, A., Penny, D., & Arnason, U. (2003). Two new avian mitochondrial genomes (penguin and goose) and a summary of bird and reptile mitogenomic features. Gene, 302, 43–52. https://doi.org/10.1016/S0378111902010533
Song, X., Huang, J., Yan, C., Xu, G., Zhang, X., & Yue, B. (2015). The complete mitochondrial genome of Accipiter virgatus and evolutionary history of the pseudo-control regions in Falconiformes. Biochemical Systematics and Ecology, 58, 75–84. https://doi.org/10.1016/j.bse.2014.10.013
Thankaswamy-Kosalai, S., Sen, P., & Nookaew, I. (2017). Evaluation and assessment of read-mapping by multiple next-generation sequencing aligners based on genome-wide characteristics. Genomics, 109, 186–191. https://doi.org/10.1016/j.ygeno.2017.03.001
Tracey, J. A., Madden, M. C., Sebes, J. B., Bloom, P. H., Katzner, T. E., & Fisher, R. N. (2017). Biotelemetery data for Golden Eagles (Aquila chrysaetos) captured in coastal southern California, February 2016-February 2017. U.S. Geological Survey Data Series 1051. https://doi.org/10.3133/ds1051
Watson, J., Riley, H., & Thomson, D. (2011). The Golden Eagle (2nd Ed.). New Haven, Connecticut: Yale University Press.
Zerbino, D. R., & Birney, E. (2008). Velvet: algorithms for de novo short read assembly using de Bruijn graphs. Genome Research, 18, 821–829. https://doi.org/10.1101/gr.074492.107


