
Lista actualizada de especies, distribución y modelaje de musgos alpinos del centro de México
Claudio Delgadillo-Moya a, *, Ana Paola Peña-Retes a, Carlos Cerrejónb
a Universidad Nacional Autónoma de México, Instituto de Biología, Departamento de Botánica, Apartado postal 70-233, 04510 Ciudad de México, Mexico
b Independent researcher
*Corresponding author: moya@ib.unam.mx (C. Delgadillo-Moya)
Received: 18 February 2025; accepted: 26 November 2025
Abstract
The Neovolcanic Belt of central Mexico is a phytogeographically significant region that influenced moss distribution patterns in the Americas. Its alpine moss flora was updated in 1971, but species range information remains fragmentary. This study updates the list and distribution of alpine mosses in the Neovolcanic Belt, and improves our understanding of these ranges by developing species distribution models (SDMs) for 4 mosses. Hypothetically, mosses reached alpine tops by migration. At lower elevations, interchange by corridors across the Belt connected ecologically similar areas and brought other species to alpine elevations. This can be tested using SDMs. SDMs provided high to relatively high prediction accuracy for all modeled species (mAUC = 0.88 ± 0.06; mCBI = 0.72 ± 0.09), and confirmed the corridor hypothesis. Overall, elevation emerged as the most important distribution predictor of target species, showing a positive sigmoidal relationship with environmental suitability. Our models effectively captured an integrated climatic signal via elevation, due to its strong negative correlation with several temperature- and precipitation-related predictors. Out of 120 alpine mosses, some are widespread in central Mexico while others are mainly distributed in eastern or western mountains. Additional fieldwork and ecological research are essential to further clarify their distribution.
Keywords: Bryophyta; Digital mapping; Machine learning; Maxent; Mexican highlands; Predictive modeling; Species distribution models
Resumen
El Eje Neovolcánico ha influido en los patrones de distribución continental de musgos. Desde 1971, no se revisaba el número y la distribución de especies alpinas. Este trabajo actualiza el listado para el Eje Neovolcánico y explica la distribución mediante modelos de distribución de especies (SDM) para 4 casos seleccionados. En teoría, los musgos se distribuyeron por migración entre zonas alpinas. El intercambio mediante corredores entre sitios ecológicamente similares de elevaciones más bajas permitió el ingreso de otras especies. Los SDM ofrecieron predicciones precisas, de alta a relativamente alta, para todas las especies modeladas (mAUC = 0.88 ± 0.06; mCBI = 0.72 ± 0.09) y confirmaron la hipótesis de los corredores. En general, la elevación fue el predictor más importante de distribución de especies, mostrando una relación sigmoidal positiva con la idoneidad ambiental. Tales modelos capturaron de manera efectiva la señal climática integrada a través de la elevación, por su fuerte correlación negativa con varios predictores relacionados con temperatura y precipitación. De 120 taxones de musgos alpinos, unos tienen distribución generalizada, otros se distribuyen principalmente en las montañas del este o del oeste. Trabajo de campo adicional explicaría mejor la distribución.
Palabras clave: Bryophyta; Mapeo digital; Aprendizaje automático; Maxent; Elevaciones mexicanas; Modelaje predictivo; Modelos de distribución
Introduction
Except for Bartram (1945, 1949) there is no major reference to alpine mosses (i.e., from above timberline) in the early bryological literature for Mexico. Floristic information frequently refers to highland moss collections with incidental direct or indirect reference to alpine species (e.g., Cardot, 1909a, b, c, 1910a, b, c, d, 1911; Hooker, 1818, 1820; Thériot, 1921, 1931, 1933). In the early 1970, results of fieldwork produced a preliminary evaluation and a list of 84 taxa in alpine habitats of central and northern Mexico (Delgadillo, 1971). Study of additional collections brought the number of mosses to 111 taxa (Delgadillo, 1984, 1987) representing 5 floristic elements (Northern, Meso-American, Southern, Wide-ranging, Endemic) according to their world ranges. These ranges were explained on the basis of hypotheses supported by ecological, geological, and geographical considerations as part of a project on the phytogeographical role of the Neovolcanic Belt of central Mexico (Delgadillo, 1985, 1987, 1988). The species shared among mountain tops indicate that these areas act as stepping-stones for moss migration and that the Mexican highlands have participated in significant floristic exchange in the Americas. Furthermore, it seems that the Neovolcanic Belt mountains also served as an incomplete barrier to moss interchange due to their geographical position and uneven elevation, especially between northern and southern areas on either side of the range. According to Delgadillo (1988, 1992, 1998, 2009) moss distribution through 7 lowland topographic discontinuities suggest that they are pathways (corridors) for migration across the Belt. Corridors in the Neovolcanic Belt occur at elevations of approximately 2,000 m in the northern portion, descending to around 1,500 m in southern areas, with some reaching up to 2,800 m (Delgadillo, 1988, 1998). These corridors contain mixed contingents of high- and lowland moss species.
The high number of species shared among alpine areas seems to support the hypothesis on the presumed interchange along the mountains of the Neovolcanic Belt. In theory, the colonizing species could spread from 1 or several points of arrival and extend their ranges toward other alpine or subalpine habitats. Modern populations are descendants already adapted to high elevations that occupy new microhabitats in the corridors.
The floristic patterns of the moss flora in the highlands are poorly represented because of the low number of samples and data collected from the alpine areas or across elevation gradients. Species distribution models (SDMs) provide useful tools for filling existing knowledge gaps on species ranges in underexplored areas by quantifying the statistical relationships between species observations and environmental conditions from known locations and spatializing these relationships across the landscape (Guillera-Arroita et al., 2015; Mateo et al., 2011). SDMs can thus offer explanations as to how current species distribution patterns became established.
This paper aims to provide a comprehensive updated list of alpine mosses and their known distribution in the Neovolcanic Belt of central Mexico, and improve our understanding of these ranges by predicting the distribution of 4 moss species selected as case studies using SDMs. We hypothesize that in addition to migration among mountain tops, moss interchange across the Neovolcanic Belt occurs via corridors connecting ecologically similar areas, as suggested by the distribution of species along the Belt (Delgadillo, 1988, 1998, 2009). SDMs were built using Maxent machine learning, which is based on the principle of maximum entropy, and known to provide accurate predictions of species distribution using presence-only data (Phillips et al., 2006; Phillips & Dudík, 2008).
Materials and methods
A revised list of alpine mosses (Table 1) in central Mexico was obtained from published records, especially the previous listing (Delgadillo, 1987), and from current herbarium holdings at MEXU; updates came from fieldwork or unreported specimens. The TROPICOS database (https://www.tropicos.org/home), the Bryophyte Nomenclator (https://www.bryonames.org), and the International Plant Names Index (https://www.ipni.org/?) were consulted for floristic and taxonomic information.
Known distribution ranges of alpine mosses
Herbarium information and data from a revised digital LATMOSS (Delgadillo et al., 1995) were then compiled to obtain the altitudinal range for each alpine moss cited in Table 1. Several species such as Leptodontium viticulosoides, Orthotrichum pycnophyllum, and Zygodon ehrenbergii frequently grow as epiphytes on phorophytes living above timberline in protected habitats; epiphytic mosses may still be labelled as alpine. Also, mosses growing in sites close to timberline, but slightly below its average altitude, may still be considered as alpine. This situation applies to various specimens whose stated altitudinal range does not reach 4,000 m. Timberline elevation varies in central Mexico; in such volcanoes as Iztaccíhuatl and Popocatépetl the mean elevation value is 4,020 m and 3,911 m, respectively, as shown by Beaman (1962). Specimens of Astomiopsis amblyocalyx and A. exserta were reported as alpine (Bartram, 1949), but since no other collections at MEXU are truly alpine, they are only listed for 2 mountains in this report. Old specimens and literature records without habitat or elevation, were not included in the original list for the alpine flora.
Table 1 distinguishes 5 groups of species. Each group includes species common to 1 or more alpine areas as represented by specimens collected there. The groups provide preliminary information on the potential distribution of the alpine moss flora in the mountains of central Mexico. Most species are distributed elsewhere, and their known altitudinal range may be an indication of their local vertical potential. Information on life-form describing the ecological response of mosses is also cited as this may offer insights on their adaptation to life in the highland environment.
Table 1
Revised list of alpine taxa and their distribution in the Neovolcanic Belt of central Mexico, known altitudinal range (Alt-rge), local distribution groups, and life-form. Abbrev.: N-COL = Nevado de Colima, IZTA = Iztaccíhuatl, POPO = Popocatépetl, TOL = Nevado de Toluca, MAL = La Malinche, P-ORIZ = Pico de Orizaba, C-PER = Cofre de Perote. C = Inland-mountain distribution, G = generalized, C-E = inland- eastern mountains, W-C = western-inland mountains, E = eastern mountains.
| Taxa | N-COL | IZTA | POPO | TOL | MAL | P-ORIZ | C-PER | Alt-rge (m asl) | Group | Life-form |
| Aligrimmia peruviana R.S. Williams | 1 | 4,150 | C | short tufts | ||||||
| Aloinella catenula Cardot | 1 | 1 | 1 | 1 | 1 | 1 | 1 | 2,500-4,020 | G | tufts |
| Amphidium tortuosum (Hornsch.) Cufod. | 1 | 1 | 1 | 1 | 1 | 2,000-4,550 | G | tufts or cushions | ||
| Anacolia laevisphaera (Taylor) Flowers | 1 | 1 | 1 | 1,800-4,400 | C-E | loose tufts | ||||
| Andreaea rupestris Hedw. | 1 | 1 | 1 | 1 | 1 | 1 | 1 | 2,950-4,420 | G | tufts or mats |
| Anoectangium aestivum (Hedw.) Spruce | 1 | 1 | 1 | 96-4,400 | C | tufts | ||||
| Anomobryum julaceum (Schrad. ex G. Gaertn., B. Mey. & Scherb.) Schimp. | 1 | 1 | 1 | 1 | 200-4,570 | W-C | tufts | |||
| Anomobryum prostratum (Müll. Hal.) Besch. | 1 | 1 | 1 | 1 | 1 | 1 | 1 | 1,700-4,700 | G | tufts |
| Table 1. Continued | ||||||||||
| Taxa | N-COL | IZTA | POPO | TOL | MAL | P-ORIZ | C-PER | Alt-rge (m asl) | Group | Life-form |
| Aongstroemia julacea (Hook.) Mitt. | 1 | 1 | 1 | 1 | 1 | 2,900-4,500 | G | loose tufts | ||
| Aongstroemia orientalis Mitt. | 1 | 1 | 1 | 1 | 1 | 1 | 1 | 1,700-4,350 | G | loose tufts |
| Astomiopsis amblyocalyx Müll. Hal. | 1 | 1 | 3,370-3,600 | C | tufts | |||||
| Astomiopsis exserta (E. B. Bartram) Snider | 1 | 3,370-3,600 | C | tufts | ||||||
| Bartramia brevifolia Brid. | 1 | 1 | 1 | 1 | 1 | 1 | 1,300-4,000 | G | loose or dense tufts | |
| Bartramia ithyphylla Brid. | 1 | 1 | 1 | 3,000-4,180 | C-E | loose or dense tufts | ||||
| Bartramia microstoma Mitt. | 1 | 1 | 1 | 1 | 1 | 1 | 2,636-4,350 | G | loose or dense tufts | |
| Bartramia potosica Mont. | 1 | 1 | 1 | 1 | 1 | 1 | 1 | 2,636-4,350 | G | loose or dense tufts |
| Brachymenium systylium (Müll. Hal.) A. Jaeger | 1 | 1 | 1 | 1,060-3,375 | G | dense tufts | ||||
| Brachythecium frigidum (Müll. Hal.) Besch. | 1 | 1 | 1 | 1 | 1 | 2,652-4,175 | C-E | mats or tufts | ||
| Brachythecium occidentale (Hampe) A. Jaeger | 1 | 1 | 1 | 1 | 2,700-4,230 | C-E | mats or tufts | |||
| Brachythecium plumosum (Hedw.) Schimp. | 1 | 1 | 1 | 1,450-4,200 | C | mats or tufts | ||||
| Brachythecium ruderale (Brid.) W. R. Buck | 1 | 1 | 1 | 1 | 1 | 1 | 1 | 1,150-4,230 | G | mats or tufts |
| Brachythecium salebrosum (Hoffm. ex F. Weber & D. Mohr) Schimp. | 1 | 1 | 2,350-3,962 | C-E | mats or tufts | |||||
| Braunia imberbis (Sm.) N. Dalton & D.G. Long | 1 | 1 | 1 | 1 | 1 | 2,300-3,950 | G | mats or tufts | ||
| Breutelia subarcuata (Müll. Hal.) Schimp. | 1 | 1 | 1 | 1,800-alpine | W-C | dense tufts | ||||
| Bryoerythrophyllum bolivianum (Müll. Hal.) R. H. Zander | 1 | 3,580-3,900 | E | loose or dense tufts | ||||||
| Bryoerythrophyllum calcareum (Thér.) R. H. Zander | 1 | 2,600-3,750 | C | loose or dense tufts | ||||||
| Bryoerythrophyllum campylocarpum (Müll. Hal.) H. A. Crum | 1 | 1 | 2,030-4,100 | C | loose or dense tufts | |||||
| Bryoerythrophyllum ferruginascens (Stirt.) Giac. | 1 | 1 | 1 | 2,500-4,000 | C | loose or dense tufts | ||||
| Bryoerythrophyllum jamesonii (Taylor) H. A. Crum | 1 | 1 | 1,400-4,300 | C | loose or dense tufts | |||||
| Bryoerythrophyllum recurvirostrum (Hedw.) Chen var. aeneum (Müll. Hal.) R. H. Zander | 1 | 1 | 1,700-3,910 | C-E | loose or dense tufts | |||||
| Bryoerythrophyllum recurvirostrum (Hedw.) Chen var. recurvirostrum | 1 | 1 | 1 | 1 | 1,070-3,970 | G | loose or dense tufts | |||
| Bryomanginia saint-pierrei Thér. | 1 | 1 | 3,600-4,350 | C | tufts | |||||
| Bryoxiphium norvegicum (Brid.) Mitt. var. mexicanum (Besch.) Sharp | 1 | 1 | 1 | 2,600-4,145 | C-E | loose tufts | ||||
| Bryum argenteum Hedw. | 1 | 1 | 1 | 1 | 1 | 1 | 1 | 700-4,100 | G | loose or dense tufts |
| Bryum billardieri Schwägr. | 1 | 1 | 1 | 1 | 1 | 1 | 650-4,120 | G | loose or dense tufts | |
| Bryum capillare Hedw. | 1 | 1 | 1 | 1 | 1 | 1 | 600-4,400 | G | loose or dense tufts | |
| Bryum cellulare Hook. ex Schwägr. | 1 | 2,000 | C | loose or dense tufts | ||||||
| Bryum pallescens Schleich. ex Schwägr. | 1 | 1 | 1 | 2,286-4,000 | W-C | loose or dense tufts | ||||
| Bryum pseudotriquetrum (Hedw.) Gaertn., Meyer & Scherb. | 1 | 1 | 1,859-4,000 | C | loose or dense tufts | |||||
| Campylopus albidovirens Herz. | 1 | 2,414-4,050 | C | dense tufts | ||||||
| Campylopus flexuosus (Hedw.) Brid. | 1 | 1,000-4,050 | C | dense tufts | ||||||
| Campylopus fragilis (Brid.) Bruch & Schimp. | 1 | 1 | 1,350-4,050 | C | dense tufts | |||||
| Campylopus nivalis (Brid.) Brid. | 1 | 1 | 1 | 1 | 1,420-4,050 | W-C | dense tufts | |||
| Campylopus tallulensis Sull. & Lesq. | 1 | 1 | 1 | 1 | 1,300-4,000 | C-E | dense tufts | |||
| Ceratodon purpureus (Hedw.) Brid. | 1 | 1 | 1 | 1 | 1,900-4,050 | C-E | loose or dense tufts | |||
| Ceratodon stenocarpus B.S.G. | 1 | 1 | 1 | 1 | 1 | 1 | 1 | 1,860-4,145 | G | loose or dense tufts |
| Coscinodon cribrosus (Hedw.) Spruce | 1 | 3,500-3,885 | C | dense cushions | ||||||
| Cratoneuron filicinum (Hedw.) Spruce | 1 | 1 | 2,440-3,900 | C | tufts or mats | |||||
| Dicranoweisia cirrata (Hedw.) Lindb. ex Milde | 1 | 2,450-4,050 | C | dense tufts | ||||||
| Dicranum frigidum Müll. Hal. | 1 | 2,134-4,200 | C | dense tufts | ||||||
| Dicranum rhabdocarpum Sull. | 1 | 1,700-3,900 | C | dense tufts | ||||||
| Didymodon australasiae (Hook. & Grev.) R. H. Zander | 1 | 1 | 1 | 40-4,020 | C-E | tufts or cushions | ||||
| Didymodon rigidulus Hedw. var. gracilis (Schleich. ex Hook. & Grev.) R. H. Zander | 1 | 1 | 1 | 1 | 1 | 1 | 1 | 1,220-4,200 | G | tufts or cushions |
| Didymodon rigidulus Hedw. var. icmadophilus (Schimp. ex Müll. Hal.) R. H. Zander | 1 | 1 | 1 | 550-alpine | G | tufts or cushions | ||||
| Distichium capillaceum (Hedw.) Bruch & Schimp. | 1 | 3,050-4,100 | C | dense tufts | ||||||
| Ditrichum gracile (Mitt.) Kuntze | 1 | 1 | 1 | 1 | 1 | 2,100-4,000 | C-E | dense tufts | ||
| Encalypta ciliata Hedw. | 1 | 1 | 1 | 1 | 1 | 1 | 1 | 2,580-4,300 | G | tufts |
| Fissidens crispus Mont. | 1 | 1 | 1,372-3,460 | C | tufts | |||||
| Funaria hygrometrica Hedw. | 1 | 1 | 1 | 850-4,000 | C | tufts | ||||
| Funaria orizabensis Müll. Hal. | 1 | 1,435-3,910 | E | tufts | ||||||
| Grimmia austrofunalis Müll. Hal. | 1 | 1 | 2,530-3,900 | C-E | dense tufts or cushions | |||||
| Grimmia donniana Sm. | 1 | 1 | 1 | 1 | 3,900-4,267 | C-E | dense tufts or cushions | |||
| Grimmia elongata Kaulf. | 1 | 1 | 1 | 1 | 1 | 1 | 1 | 3,700-4,520 | G | dense tufts or cushions |
| Grimmia fuscolutea Hook. | 1 | 1 | 1 | 1 | 1 | 1 | 1 | 2,432-4,200 | G | dense tufts or cushions |
| Grimmia longirostris Hook. | 1 | 1 | 1 | 1 | 1 | 1 | 1,220-4,350 | G | dense tufts or cushions | |
| Grimmia mexicana Greven | 1 | 1 | 1 | 1 | 1 | 1 | 1 | 3,500-4,300 | G | dense tufts or cushions |
| Grimmia montana Bruch & Schimp. | 1 | 1 | 1 | 1 | 1 | 1 | 1,524-4,633 | C-E | dense tufts or cushions | |
| Grimmia ovalis (Hedw.) Lindb. | 1 | 1 | 2,020-3,070 | E | dense tufts or cushions | |||||
| Grimmia torquata Drumm. | 1 | 1 | 1 | 3,750-4,267 | C-E | dense tufts or cushions | ||||
| Grimmia trichophylla Grev. | 1 | 1 | 1 | 1 | 1 | 1 | 610-4,200 | G | dense tufts or cushions | |
| Hennediella longirostris (Hampe ex Müll. Hal.) R. H. Zander | 1 | 1 | Alpine | C-E | tufts | |||||
| Hennediella polyseta (Müll. Hal.) R. H. Zander | 1 | 1 | 1 | 3,650-4,100 | C-E | tufts | ||||
| Hymenolomopsis tolucensis Thér. | 1 | 1 | 1 | 3,500-4,300 | G | tufts | ||||
| Hypnum cupressiforme Hedw. var. cupressiforme | 1 | 2,700-3,600 | C | mats | ||||||
| Hypnum cupressiforme Hedw. var. lacunosum Brid. | 1 | 1 | 1 | 1 | 2,580-4,150 | C-E | mats | |||
| Hypnum revolutum (Mitt.) Lindb. | 1 | 1 | 1 | 1 | 1 | 2,500-4,350 | C-E | mats | ||
| Leptodictyum riparium (Hedw.) Warnst | 1 | 1 | 914-3,310- alpine | W-C | mats | |||||
| Leptodontium flexifolium (Dicks. ex With.) Hampe | 1 | 1 | 1 | 1 | 1 | 1 | 1 | 1,237-4,350 | G | loose tufts |
| Leptodontium pungens (Mitt.) Kindb. | 1 | 1 | 1 | 1 | 1 | 1 | 2,375-4,380 | C-E | loose tufts | |
| Leptodontium viticulosoides (P. Beauv.) Wijk & Marg. var. viticulosoides | 1 | 1 | 1 | 1 | 1 | 1,100-4,000 | G | loose tufts | ||
| Leptodontium viticulosoides var. sulphureum (Müll. Hal.) R. H. Zander | 1 | 1 | 1 | 1 | 1,372-4,000 | C-E | loose tufts | |||
| Leptopterigynandrum tenuicaule (R.S. Williams) S. He | 1 | 1 | 1,200-4,400 | C-E | mats | |||||
| Lepyrodon tomentosus (Hook.) Mitt. | 1 | 300-4,280 | E | cushion or mats | ||||||
| Mielichhoferia argentifolia Mitt. | 1 | 1 | 1 | 3,840-4,050 | C-E | tufts | ||||
| Mironia ehrenbergiana (Müll. Hal.) R. H. Zander | 1 | 1 | 1 | 1 | 1 | 1 | 1 | 3,880-4,200 | G | tufts |
| Mironia stenotheca (Thér.) R.H. Zander | 1 | 1 | 1 | 1 | 1 | 2,870-3,962 | G | tufts | ||
| Neosharpiella aztecorum H. Rob. & Delgad. | 1 | 1 | 1 | 1 | 1 | 1 | 3,370-4,200 | C-E | tufts | |
| Notoligotrichum mexicanum (G. Smith) G. Smith | 1 | 1 | 1 | 1 | 4,350 | C | tufts | |||
| Oreoweisia erosa (Hampe ex Müll. Hal.) Kindb. | 1 | 1 | 1 | 2,140-3,700-alpine | C | tufts | ||||
| Orthodontium gracile Schwägr. ex B.S.G. | 1 | 1 | 2,600-3,970 | W-C | tufts | |||||
| Orthotrichum pycnophyllum Schimp. ex Müll. Hal. | 1 | 1 | 1 | 1,340-3,950 | C-E | tufts | ||||
| Paraleucobryum enerve (Thed. ex Hartm.) Loeske | 1 | 1 | 1 | 1 | 2,682-4,350 | C-E | dense tufts | |||
| Philonotis corticata H. A. Crum & Griff. | 1 | 1 | 1 | 1 | 1 | 1 | 1 | 3,800-4,200 | G | tufts |
| Pleuridium mexicanum Cardot | 1 | 1 | 1 | 1,859-4,050 | C | tufts | ||||
| Pogonatum jamesonii (Taylor) B.H. Allen | 1 | 1 | 1 | 1 | 1 | 1 | 1,750-4,000 | G | tufts | |
| Pohlia cruda (Hedw.) Lindb. | 1 | 1 | 1 | 1 | 1 | 1 | 1 | 3,300-4,200 | G | tufts |
| Pohlia elongata Hedw. | 1 | 1 | 1 | 1 | 1 | 1 | 1 | 1,524-4,180 | G | tufts |
| Pohlia oerstediana (Müll. Hal.) A.J. Shaw | 1 | 1 | 1 | 1 | 1 | 2,520-4,180 | G | tufts | ||
| Polytrichastrum alpinum (Hedw.) G. Smith | 1 | 1 | 1 | 1 | 1 | 1 | 3,880-4,300 | G | tufts | |
| Polytrichastrum tenellum (Müll. Hal.) G. Smith | 1 | 1 | 1 | 1 | 1 | 2,530-3,970 | G | tufts | ||
| Polytrichum juniperinum Hedw. | 1 | 1 | 1 | 1 | 1,000-4,350 | C-E | tufts | |||
| Racomitrium crispipilum (Taylor) Spruce | 1 | 1 | 1 | 1 | 1 | 2,470-4,100 | C-E | mats or tufts | ||
| Racomitrium subsecundum (Hook. & Grev. ex Harv.) Mitt. | 1 | 1 | 1 | 1 | 1 | 1 | 2,570-4,000 | G | mats or tufts | |
| Rhabdoweisia crispata (Dicks. ex With.) Lindb. | 1 | 1 | 2,900-4,020 | C | tufts | |||||
| Rhabdoweisia fugax (Hedw.) Bruch & Schimp. | 1 | 1 | 1 | 2,410-4,000 | C | tufts | ||||
| Rhytidium rugosum (Hedw.) Kindb. | 1 | 2,000-3,658 | E | tufts | ||||||
| Sagenotortula quitoensis (Taylor in Hook.) R. H. Zander | 1 | 1 | 2,240-alpine | C-E | tufts | |||||
| Sanionia uncinata (Hedw.) Loeske | 1 | 1 | 1 | 1 | 3,036-4,415 | C | mats or tufts | |||
| Saitobryum lorentzii (Müll. Hal.) Ochyra | 1 | 1 | 3,300-3,700 | C | tufts | |||||
| Schizymenium campylocarpum (Arn. & Hook.) A.J. Shaw | 1 | 1 | 1 | 1 | 1 | 1 | 2,896-4,300 | G | tufts | |
| Schizymenium schiedeanum (Müll. Hal.) A.J. Shaw | 1 | 1 | 1 | 1 | 1 | 1 | 2,760-4,100 | G | tufts | |
| Schizymenium serratum (Cardot & Herzog) A.J. Shaw | 1 | 1 | 2,600-4,000 | C-E | tufts | |||||
| Syntrichia andicola (Mont.) Ochyra | 1 | 1 | 1 | 1 | 1 | 1 | 3,700-4,430 | C-E | tufts | |
| Syntrichia obtusissima (Müll. Hal.) R. H. Zander | 1 | 200-4,300 | E | tufts | ||||||
| Syntrichia ruralis (Hedw.) Web. & Mohr | 1 | 1 | 1 | 1 | 600-4,200 | C-E | tufts | |||
| Tayloria splachnoides (Schwägr.) Hook. | 1 | 1 | 1 | 1 | 3,300-3,962 | C-E | tufts | |||
| Tristichium mirabile (Müll. Hal.) Herz. | 1 | 1 | 3,950-4,350 | C | tufts | |||||
| Zygodon ehrenbergii Müll. Hal. | 1 | 1 | 1 | 1 | 2,500-4,000 | G | tufts | |||
| Zygodon pichinchensis (Taylor) Mitt. | 1 | 1 | 1 | 1 | 1 | 1 | 3,870-4,300 | G | tufts | |
| Zygodon viridissimus (Dicks.) Brid. | 1 | 1 | 2,765-3,950 | C-E | tufts | |||||
| Total number of taxa = 120 | 48 | 86 | 72 | 85 | 44 | 62 | 65 |
Species distribution modeling of case study mosses
Herbarium and literature sources are sometimes insufficient to obtain reliable data for analysis. Various species, including Grimmia pulla, Orthotrichum pycnophyllum, and Zygodon ehrenbergii were evaluated for their distribution as corridor or alpine species. Specimens of these 3 taxa were few in number, rarely alpine and thus not entirely useful to test our hypothesis; 4 other species were selected because their habitat and elevation were well-known from various alpine localities and substrates in the Neovolcanic Belt. MEXU holds sufficient number of georeferenced specimens of Brachythecium occidentale and B. plumosum, 2 of the few pleurcarpous mosses that grow mainly on soil or rocks. Grimmia longirostris and G. trichophylla are broadly represented in our records, they are acrocarpous rupicolous species, and sometimes the latter also occurs on soil and trunks. Information for Grimmia was further complemented with specimen data from other international herbaria consulted in a recent review of the genus (Delgadillo, 2015). Besides habitat, the species selected are known for their broad altitudinal ranges, from the alpine areas to 2,000 m or more below timberline. Actual distribution records were expected to show their presence in the lowland corridors between the high peaks and on the southern slopes of Neovolcanic Belt mountains. The Neovolcanic Belt delimitation was based on the Neovolcánico map “Provincias biogeográficas de México” (Scale 1:4 000 000; Conabio, 1997), which was subsequently used to compute our environmental predictors and as the calibration and prediction area for our models.
To prevent inflated predictive accuracy and biases in distribution range estimates, we evaluated and removed spatial autocorrelation from the records of each species prior to model construction, using R v.4.3.2 (R Development Core Team, 2023). Initially, we performed a Moran’s I test with 999 permutations using the moran.mc() function from the spdep package v.1.3-3 (Bivand & Wong, 2018), which detected the presence of spatial autocorrelation for the 4 target species (mean Moran’s I = 0.170 ± 116, p-values < 0.05). Two spatial filtering distances were then tested to remove autocorrelation, 1 km and 10 km, with only the 10-km filter successfully removing autocorrelation, as confirmed by a second Moran’s I test (mean Moran’s I = -0.004 ± 0.001, p-values > 0.05). Spatial filtering was carried out using the thin() function of the spThin package v.0.2.0 (Aiello-Lammens et al., 2015). The final number of occurrences available for modeling in this region was 37, 25, 50, and 29 for B. occidentale, B. plumosum, G. longirostris, and G. trichophylla, respectively (Supplementary material: Table 1).
Environmental predictor selection and modeling approach
Climatic and topographic predictors were preselected according to their known influence on bryophyte distribution and diversity (Cerrejón et al., 2020, 2022). Bioclimatic predictors included the 19 variables provided by WorldClim 2.1, which were acquired at ~ 1 km spatial resolution using the worldclim_country() function of the geodata package v.0.6-2 (Hijmans et al., 2024) in R v.4.3.2 (R Development Core Team, 2023). To develop our topographic predictors, the digital elevation model of the Shuttle Radar Topography Mission (SRTM) was obtained from Google Earth Engine (Gorelick et al., 2017) at 1 km spatial resolution to match that of the bioclimatic predictors. Topographic predictors comprised elevation, slope, Topographic Position Index (TPI) and Beer’s aspect. TPI refers to the relative elevation at each cell compared to its surrounding environment (here calculated using a circle neighborhood of 1 cell), while Beer’s aspect is a measure of incident solar radiation (Vanderpuye et al., 2002). All predictors were standardized (mean = 0, sd = 1).
Predictor multicollinearity was tested using a set of 10,000 random background points and the collinear() function of the collinear R package v.1.1.1 (Benito, 2023). This function automatically removed highly correlated predictors (here, |Spearman r|) > 0.7; Dormann et al., 2012) and those that are linear combinations of other predictors (Variance inflation factor > 10; Kutner et al., 2005). To avoid model overfitting, we further limited the inclusion of predictors for each species based on their number of available observations, maintaining a predictor-to-observation ratio of 1:10 (Harrell et al., 1996; Peduzzi et al., 1996). For this predictor selection step, we performed preliminary Maxent models by species to identify and keep the most important predictors in each case that ensured the 1:10 ratio. More specifically, permutation importance and percent contribution were used to assess the relative importance of environmental predictors in each preliminary model (Supplementary material: Table 2). Predictors with both permutation importance and percent contribution equal to zero were removed. Aside from the number and identity of predictors used, these preliminary models were computed using the same parameterization and configuration as the final models described in the following paragraph. This resulted in a set of 4 non-collinear predictors, comprising 2 bioclimatic and 2 topographic variables (Table 2). Since presence-only data were used, 10,000 background points were randomly generated across the study area to define the available environment for all species and run the models.
Maxent models were then computed using the final set of predictors selected for each species, which ranged from 3 to 4 predictors, and included BIO2, BIO3, elevation and slope (Table 2). Models were run through the ENMevaluate() function of the ENMeval R package v.2.0.5.2 (Kass et al., 2021) using the maxent.jar implementation of the Maxent algorithm. Occurrence and background data were partitioned using the “randomkfold” method (5 folds). A range of feature class combinations (linear [L], linear + quadratic [LQ], linear + quadratic + hinge [LQH], and hinge [H]) and regularization multipliers (1 to 5) were tested (Phillips et al., 2006; Phillips & Dudík, 2008), resulting in a total of 20 candidate models with different configurations per species. We then identified the best-performing model per species based on the (lowest) AICc values obtained across their candidate models (Burnham & Anderson, 2004; Warren & Seifert, 2011). AICc is a comprehensive suitable metric for model selection that balances goodness-of-fit with model complexity (i.e., number of parameters), allowing us to identify the most parsimonious model and reduce the risk of overfitting. The predictive performance of each best-performing model was assessed via 5-fold cross-validation using 2 threshold-independent metrics, namely the area under the receiver operating characteristic curve (AUC; Fielding & Bell, 1997), and the continuous Boyce Index (CBI; Boyce et al., 2002; Hirzel et al., 2006). AUC ranges from 0 for an inverse model, to 0.5 for a random model to 1 for a perfect model, while the CBI varies from 1 for an inverse model, to 0 for a random model to 1 for a perfect model. The best-performing models were subsequently used to generate spatial predictions of environmental suitability (continuous values, 0-1) per species at 1 km resolution across the study area using the “cloglog” transformation (Phillips et al., 2017). In addition, we generated binary models (presence/absence) using the maximum training sensitivity plus specificity threshold, which is a robust method in species distribution modeling due to its insensitivity to species prevalence and its effectiveness in balancing omission and commission errors (Freeman & Moisen, 2008; Jiménez-Valverde & Lobo, 2007; Liu et al., 2013). Variable importance for predicting species distribution was evaluated via jackknife test, while the effects of these predictor variables were evaluated through species response curves.
To test our hypothesis, corridors were spatially defined at elevations between 1,800 m and 2,700 m in the Neovolcanic Belt. The lower limit of 1,800 m was chosen as a compromise between the higher lower-elevation limit in the northern portion (~ 2,000 m) and the lower limit in the southern portion (~ 1,500 m) of the region (Delgadillo, 1988, 1998). We then assessed the predicted presence of our species within corridors by overlaying their binary predictions with the corridor classification map.
Results
There are 120 specific and infraspecific taxa in the known alpine moss flora of the Neovolcanic Belt in central Mexico (Table 1). This table shows records from the western-most mountain (Nevado de Colima in Jalisco) eastwards to those near the Gulf of Mexico coastline (Pico de Orizaba and Cofre de Perote) in Veracruz. The number of taxa per mountain may reflect an uneven sampling due to the size and ease of access. La Malinche and Nevado de Colima, with the lowest known numbers of alpine mosses (44 and 48, respectively), seem to have been visited by few professional bryologists; the highest values correspond to the mountains near Mexico City and Toluca. There are other mountains along the Belt that reach 4,000 m in elevation, but there are few or no bryophyte collections are available from them.
Species in Table 1 may be divided in various groups according to their mountain distribution. Group G includes 43 species recorded from all or most of the mountains studied. Group C comprises 32 taxa known from the inland mountains studied, i.e., recorded from the mountains further away from coastal areas; their distribution may be similar to those in the G group, but have remained undetected in other areas because they may be somewhat inconspicuous or inhabit poorly collected mountains. Species in Group C-E (33) and E (6) are similar in distribution but are shared with eastern elevations, i.e., Pico de Orizaba and/or Cofre de Perote. A small group labelled W-C seem to be absent from the alpine areas of the eastern mountains.
Table 2
Description of selected environmental predictors by category used to model and map the distribution of Brachythecium occidentale (BOCC), Brachythecium plumosum (BPLU), Grimmia longirostris (GLONG), and Grimmia trichophylla (GTRI).
| Predictors | Description | Category | BOCC | BPLU | GLONG | GTRI |
| BIO2 | Mean Diurnal Range (Mean of monthly max temp – min temp) (°C) | Bioclimate | x | x | x | |
| BIO3 | Isothermality (BIO2/BIO7) (×100) (%) | Bioclimate | x | |||
| Elevation | Continuous topographic elevation surface through the cells (m) | Topography | x | x | x | x |
| Slope | Maximum rate of change in value from one cell to its immediate neighbors (degrees) | Topography | x |
AUC and CBI metrics showed high to relatively high predictive accuracy across all candidate Maxent models evaluated per species resulting from different configurations of feature classes and regularization multipliers (Fig. 1). While B. plumosum, G. longirostris, and G. trichophylla were best predicted using a LQ model, a more complex LQH model performed best for B. occidentale; regularization multipliers varied between 1 and 2 across species (Table 3). The best performing models for each species showed validation AUC and CBI values ranging from 0.83 to 0.94 and from 0.61 to 0.82 (Table 3), indicating, respectively, high predictive accuracy and generally strong agreement between observed and predicted suitability.
The predictive mapping shows that all modeled species are expected to occur in alpine and adjacent highland areas of the Neovolcanic Belt, as well as in corridors, although to varying extents (Fig. 2). These distribution patterns are clearly visible in our binary predictions (Fig. 2D, F, H, J), where dark and light green colors correspond to the predicted presence of the species outside and within corridors, respectively. Specifically, B. occidentale, G. longirostris, and, to a lesser extent, G. trichophylla are expected to occur in corridors acrosscentral and eastern sites of the Neovolcanic Belt, while B. plumosum only is restricted to corridors in the easternmost portion of this region. Brachythecium and a few other pleurocarpous mosses in the alpine areas of central Mexico form mats and tufts (Table 1). Tufts or cushions seem to characterize most acrocarpous mosses including several species of Grimmia at these high elevations that seem to have a wider distribution there. Maps show the areas of occurrence where herbarium specimens record actual findings; G. longirostris was recently collected in other sites outside the Neovolcanic Belt. Most new findings occur in comparatively lower localities in drier areas.
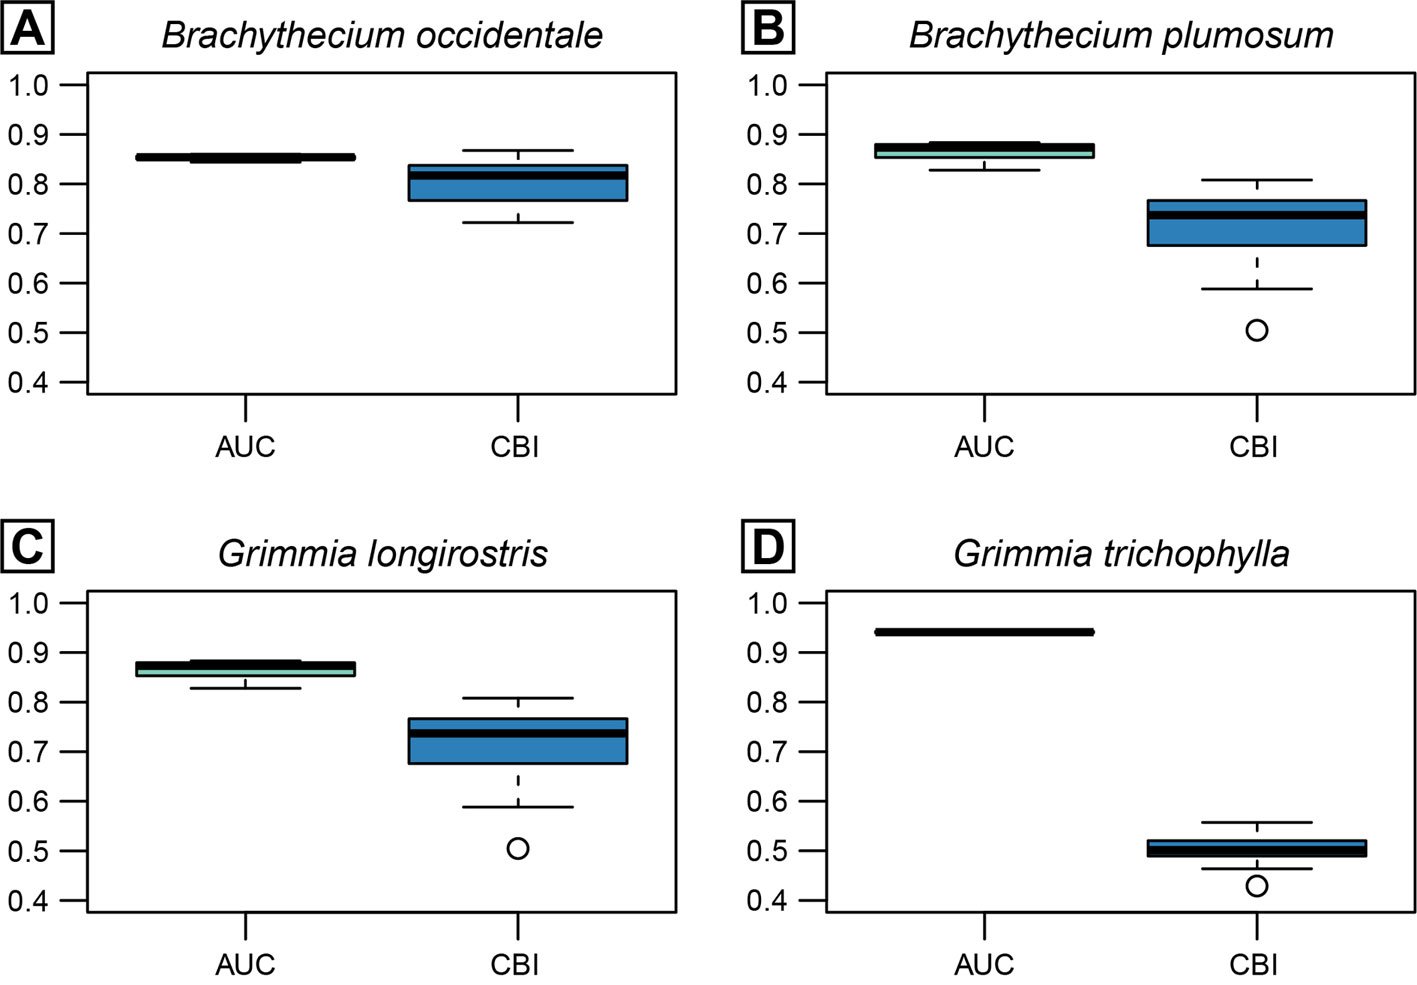
Table 3
Configuration of the best-performing Maxent model for each target species, along with the performance metrics from 5-fold cross-validation, including the area under the receiver operating characteristic curve (AUC) and the continuous Boyce Index (CBI). Feature class abbrev.: LQ, linear + quadratic; LQH, linear + quadratic + hinge.
| Species | Feature class | Regularization multiplier | AUC | CBI |
| Brachythecium occidentale | LQH | 2 | 0.83 | 0.82 |
| Brachythecium plumosum | LQ | 1 | 0.92 | 0.61 |
| Grimmia longirostris | LQ | 2 | 0.84 | 0.72 |
| Grimmia trichophylla | LQ | 1 | 0.94 | 0.73 |
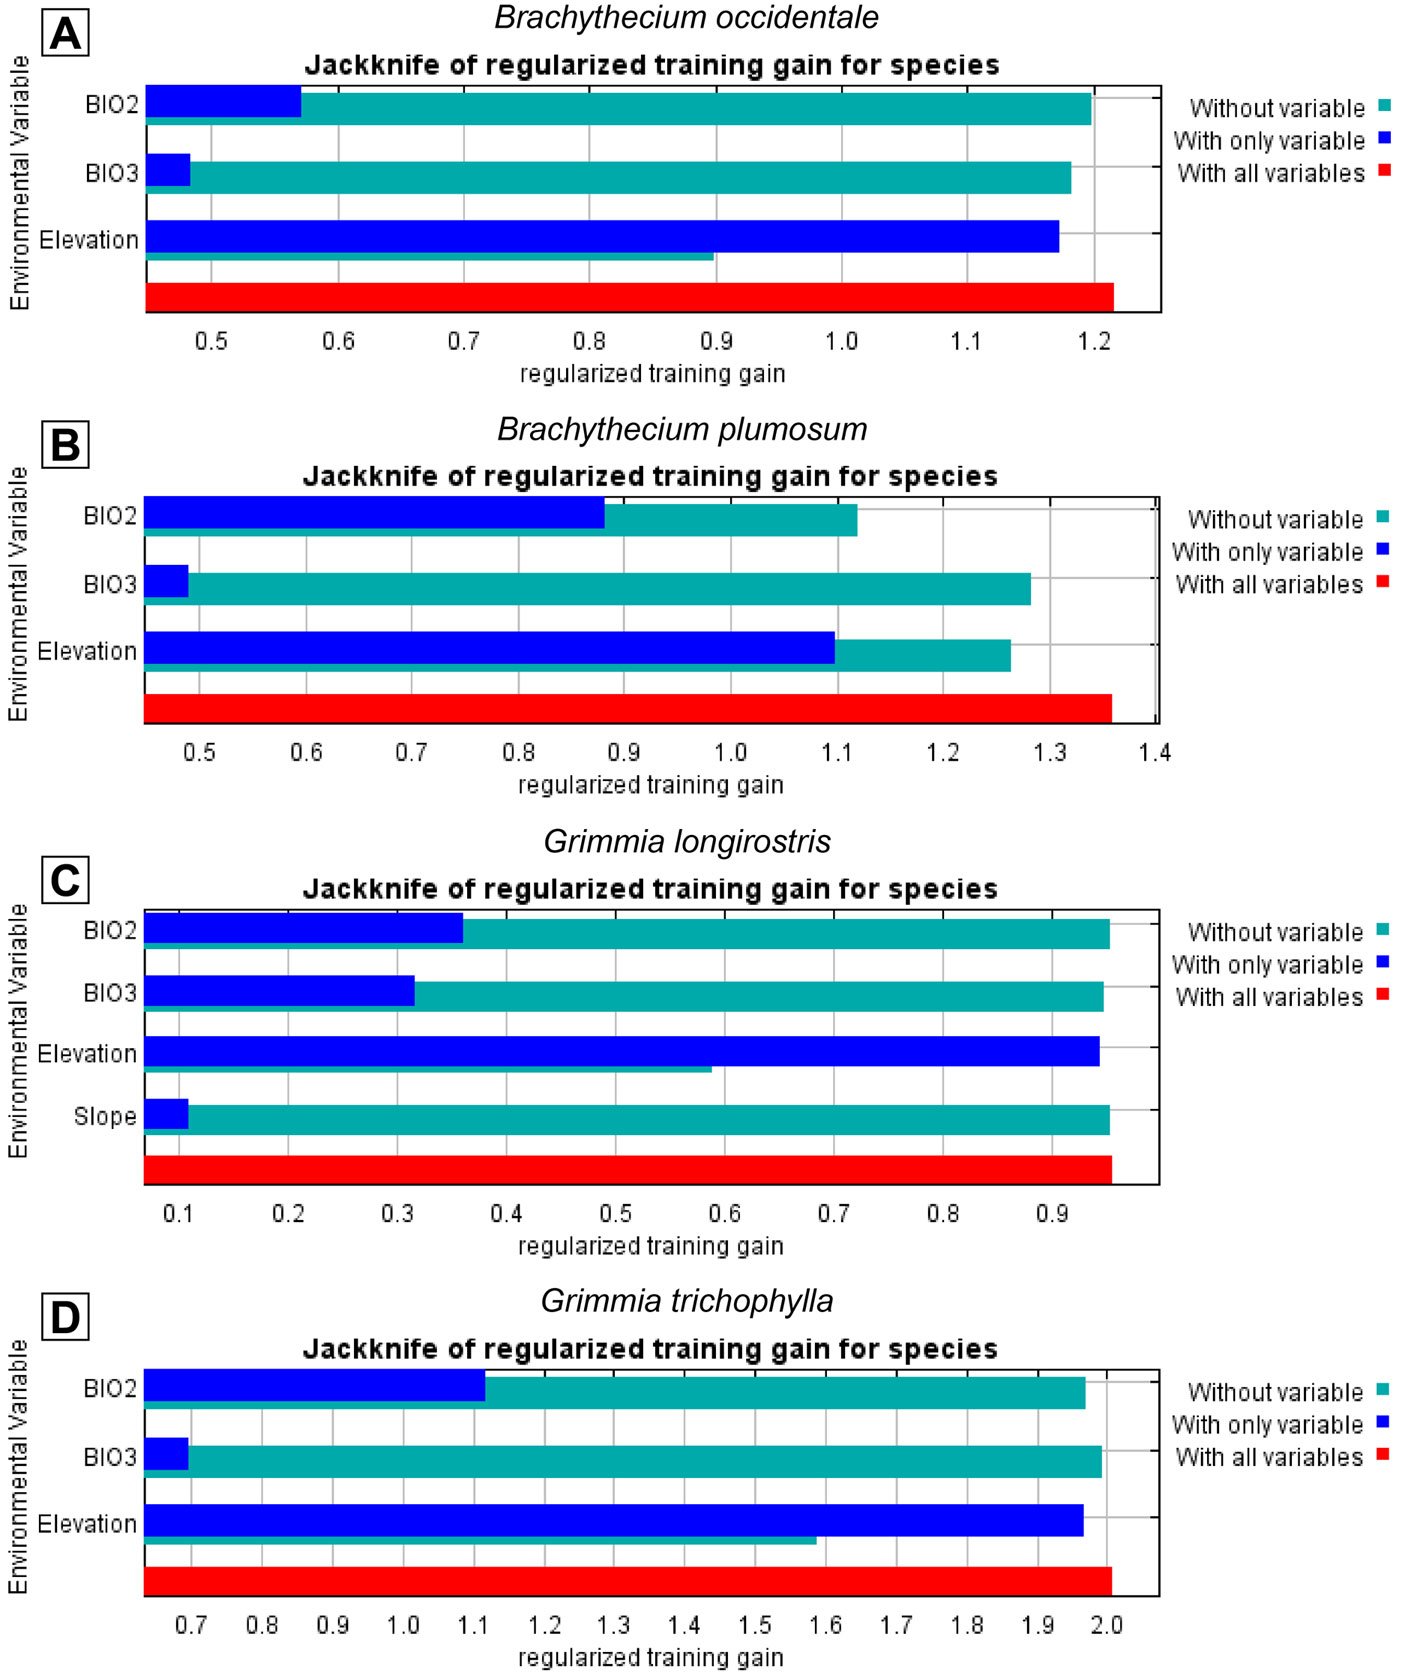
Final models for all 4 species consistently included elevation, which emerged as the most influential predictor of the distribution of B. occidentale, G. longirostris, and G. trichophylla, yielding the highest gain in performance when used in isolation and causing the greatest drop when excluded from the model(Fig. 3). In contrast, B. plumosum was best predicted by BIO2 (Mean Diurnal Range), as evidenced by the greatest decrease in model performance when this predictor was omitted, with elevation playing a secondary but still relevant role. The remaining predictors retained in the final models showed only marginal contributions, including BIO2 and BIO3 (Isothermality) for B. occidentale, and slope and BIO2 for G. longirostris and G. trichophylla, respectively (Fig. 3). Regarding species response curves, elevation exhibited a positive sigmoidal relationship with environmental suitability across the 4 target species, with suitability values increasing with elevation (Supplementary material: Fig. 1). More specifically, all species showed an increase in predicted environmental suitability from intermediate values (0.5) at elevations between 2,000 m and 2,300 m to high suitability values (≥ 0.8) at elevations equal to or exceeding approximately 2,700 m, with their environmental optimum (asymptote) reached at elevations equal to or exceeding 2,600 m for both Brachythecium species and 3,200 m for the Grimmia species (Supplementary material: Fig. 1). On the other hand, BIO2 showed a reversed sigmoidal relationship with environmental suitability for B. plumosum, with suitability values decreasing as BIO2 values increased (Supplementary material: Fig. 1). Specifically, high environmental suitability values (≥ 0.8) were associated with BIO2 values of approximately ≤ 13 °C, with the environmental optimum (asymptote) occurring at BIO2 values ≤ 12.5 °C; environmental suitability for B. plumosum decreased to intermediate values (0.5) at BIO2 values equal to 14.5 °C (Supplementary material: Fig. 1).
Discussion
This contribution is based on previous proposals related to Mexican alpine mosses. The first concerns the degree of floristic similarity among mountain tops along the Neovolcanic Belt. The second is related to mosses distributed along lower sites or pathways that overcome, to some degree, the barrier effect of the mountain range.
Delgadillo (1971) and Mastretta-Yanes et al. (2015) introduced hypothetical considerations of the role of geological events on plant occupancy of highland areas. The sum effect of historical events and the ecological response of mosses are responsible for their distribution. Previous work proposed interchange and migration as the explanation for the floristic similarity across latitudes in the alpine areas of the Neovolcanic Belt (Delgadillo, 1971, 1987). In the revised list (Table 1), species common to mountain tops indicate certain degree of floristic similarity. Specifically, the Sørensen dissimilarity Index brings together Nevado de Colima and La Malinche (Supplementary material: Fig. 2), 2 distant areas with poor collecting records; Nevado de Toluca and Cofre de Perote are also geographically distant but their floristic similarity groups them together. A geographical similarity trend may not be demonstrated because alpine areas differ in size, collecting effort, and number of specimens available for comparison. By groups, however, the distribution of species in group G, groups C and C-E complement to cover the entire Belt. In group E, Bryoerythrophyllum bolivianum, Funaria orizabensis, Grimmia ovalis, Lepyrodon tomentosus, Rhytidium rugosum, and Syntrichia obtusissima are mainly known from the eastern mountains. In group W-C, Bryum pallescens and Orthodontium gracile are mainly distributed in western localities. The distribution gaps may fill out through additional field work, but if the pattern persists, it may indicate that interchange and migration have a directional trend.
Alpine moss species in central Mexico are found around 4,000 m in elevation (Table 1), but their range may exhibit a broad altitudinal interval (1,500- 2,000 m). Extreme low elevations are known for certain species (e.g., Anomobryum spp.), while others may be found as far high as 4,600-4,700 m (Grimmia montana). Most species in the alpine flora are acrocarpous and grow in tufts, cushions or mats inhabiting soil, humus or rocks. Among the frequent occupants of extreme habitats are species of Grimmia whose distribution may extend downwards in naturally open or disturbed spaces. Few pleurocarpous mosses occur in the alpine areas (Brachythecium, Leptodictyum, Leptopterigynandrum, and Sanionia) where they grow in mats (or tufts), on rocks or soil. By definition, epiphytism is an exceptional condition for mosses in the alpine environment and thus, contributes little to floristic similarity of extreme mountain tops; in protected enclaves, some trees or shrubs may still harbor species of Orthotrichum and Zygodon.
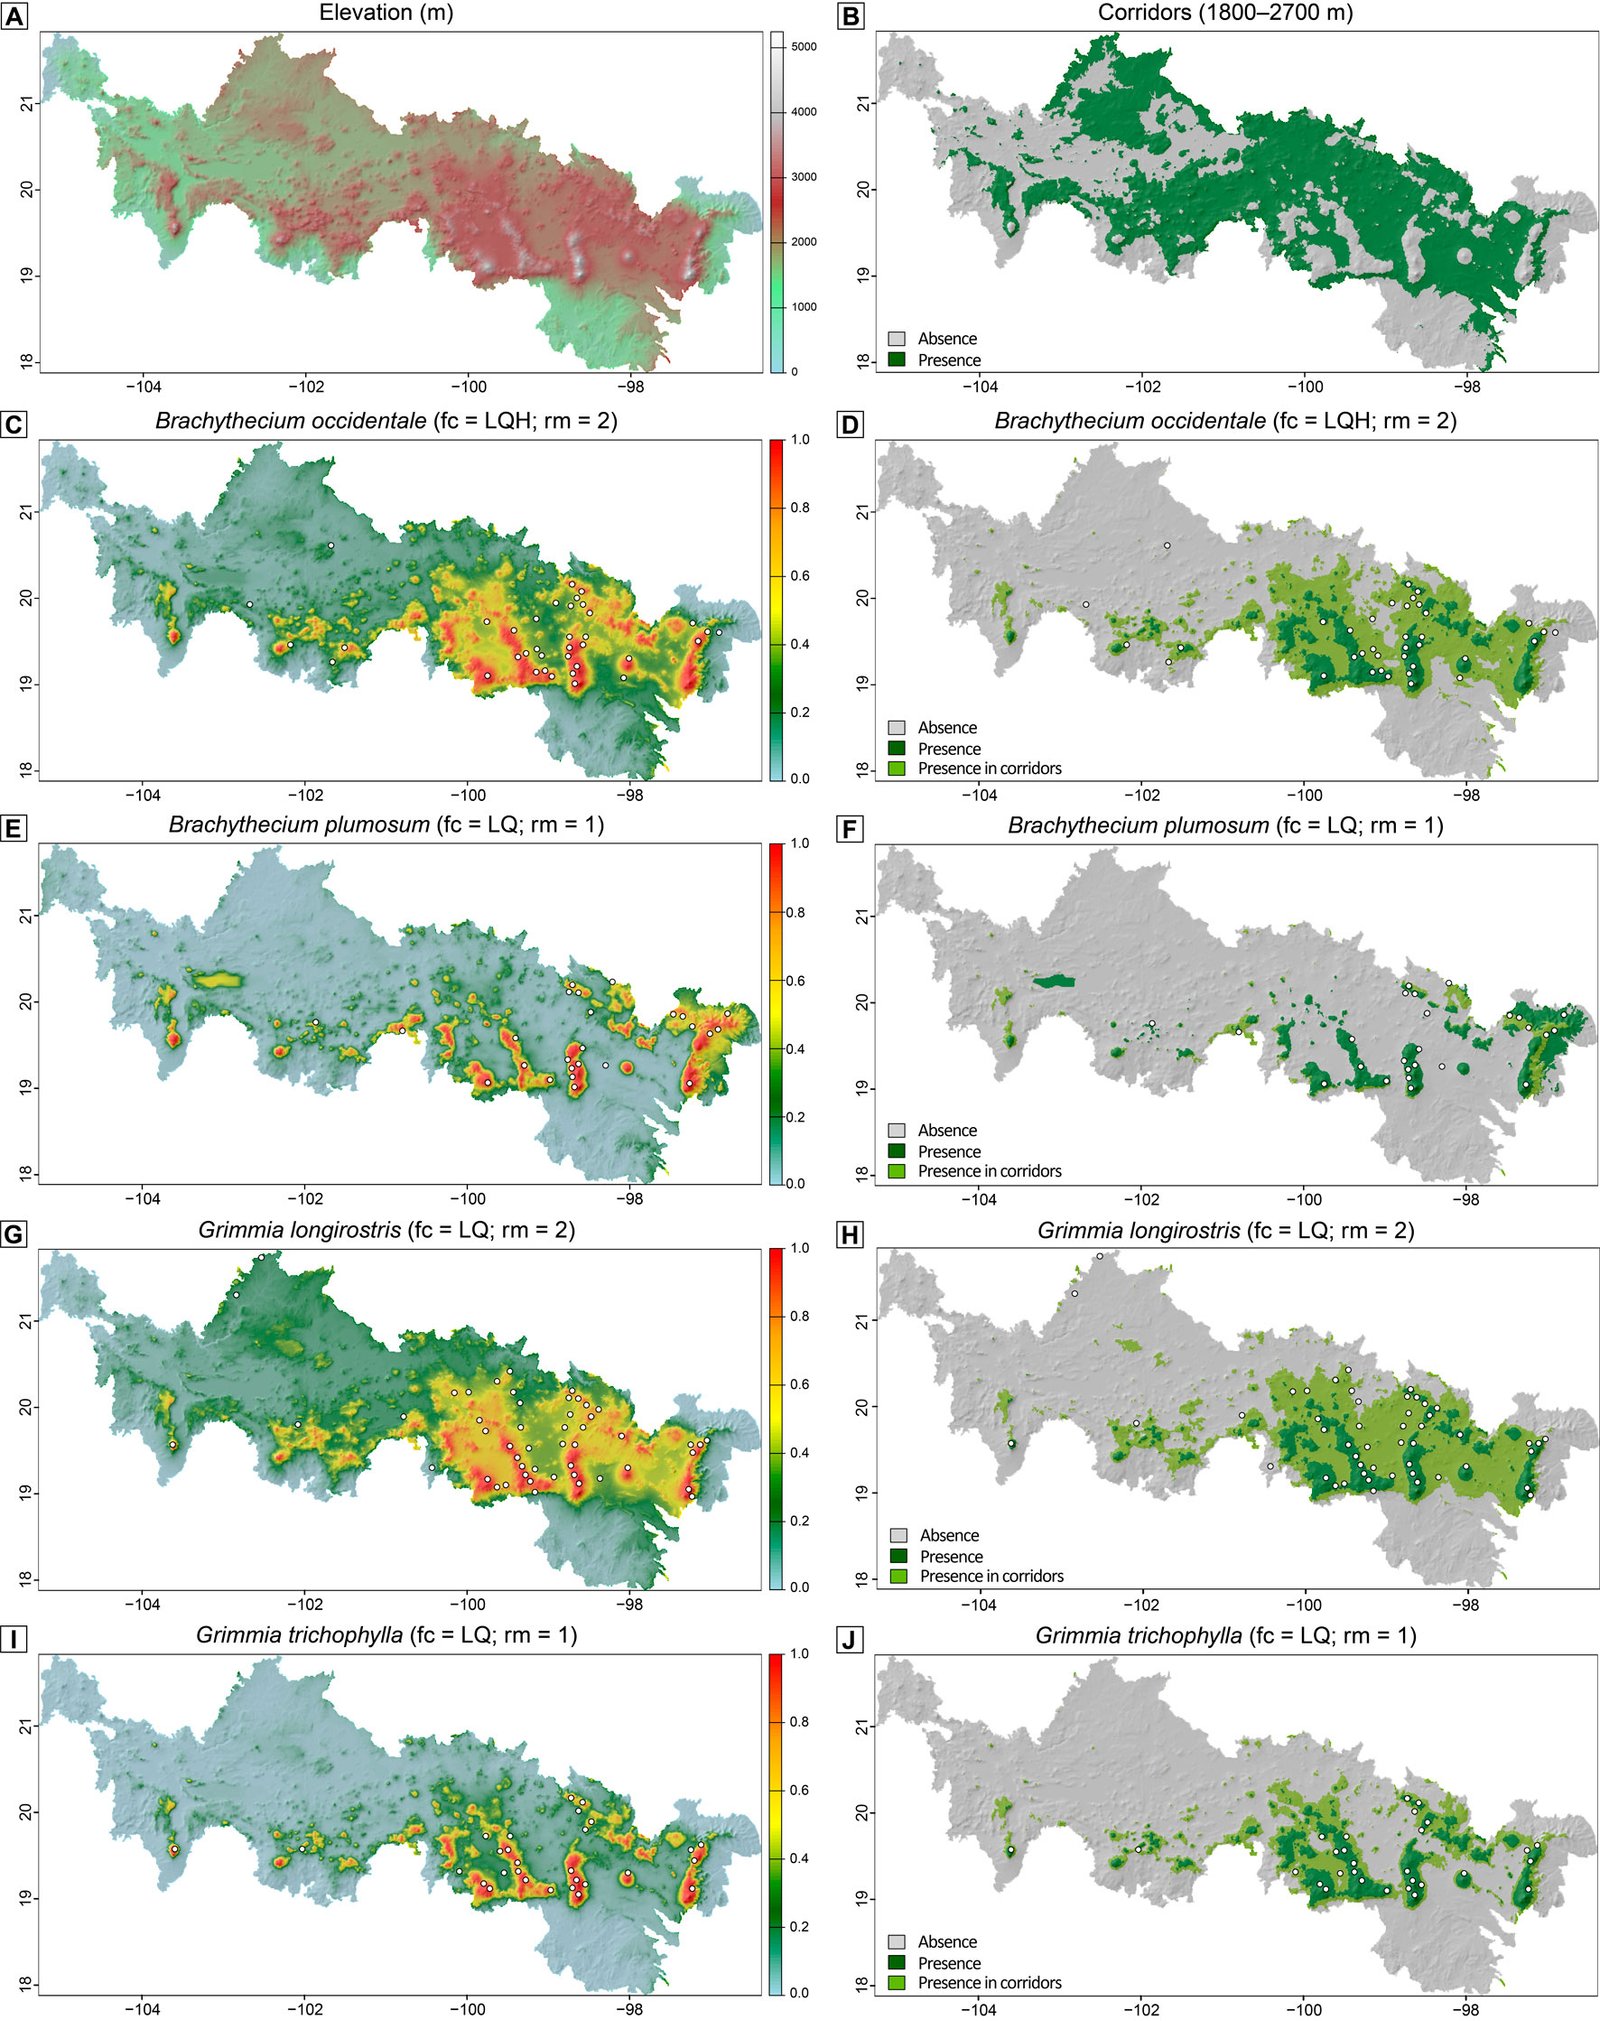
The barrier effect of the Neovolcanic Belt is not complete. Herbarium records indicate that there are alpine species present on either side of the mountain range that are also part of the flora in lower elevations. Results from SDMs show that Brachythecium and Grimmia are capable of inhabiting corridor elevations, mainly in central and eastern sites, with B. plumosum restricted to the easternmost corridor areas of the region (Fig. 2). These results confirm our corridor hypothesis and indicate that both acrocarpous and pleurocarpous mosses can move across mountain ranges; both are also known from lower dry habitats in northern states (Delgadillo-Moya & Peña-Retes, 2017; Sharp et al., 1994). Overall, elevation emerged as the dominant predictor of distribution of the 4 modeled alpine moss species, with a consistent sigmoidal increase of habitat suitability toward high elevations. Because elevation was strongly (negatively) correlated with multiple temperature-related bioclimatic variables (BIO1, BIO5, BIO6, BIO8–BIO11) and with Precipitation of Wettest Month (BIO13), our models effectively captured an integrated climatic signal via elevation. This pattern is expected along mountain altitude gradients where elevation systematically influences temperature and moisture regimes via orographic lifting (Franklin, 2010). Beyond elevation, the particular importance of BIO2 for predicting the distribution of B. plumosum, along with its negative sigmoidal relationship with predicted habitat suitability, suggests that this species may be particularly sensitive to fine-scale thermal fluctuations. The identification of these key predictors highlights the relevance of thermal and moisture constraints in shaping habitat suitability for the target mosses. Ecophysiological studies on the mechanisms underlying the effect of elevation on moss occurrence, for example through their photosynthetic responses are, however, still scarce and context-dependent (Wang et al., 2022).
In order to offset the barrier effect, displacement from other altitudes would require mosses to overcome ecological hindrances related to high insolation, temperature fluctuation, and water deficit that prevent successful occupation of exposed habitats in the highlands.
Acrocarpous moss growth has solved difficulties in the occupation and spread in alpine and highland areas. Since light for photosynthesis is not a limiting factor in the open habitats, water economy becomes critical for moss plants. It may move by capillary systems involving leaf arrangement and structure, and leaf papillae (cf. Proctor, 1979). These structures and stem aggregation, tomentum, and other structures present in cushions, compact turfs, and mats seem to reduce water loss. In the presence of hair points solar radiation and evaporation can be reduced by 20% or more in species of Tortula and Grimmia (Proctor, 1984). Pleurocarpous mosses such as Brachythecium, by comparison, occupy larger soil surfaces, and do not seem to cover large patches in the alpine area unless near a water source; exposed substrates in corridor areas may limit the spread of mosses that dry out rapidly.
Dispersal is a complex mechanism that seldomly cited for highland mosses. Numerous references may be consulted on the subject, with special reference to spores and other propagules that disperse mosses (for summaries, see Delgadillo & Pérez-Bandín, 1982; Richardson, 1981; Wyatt & Anderson, 1984). In general, the sporophytes in both acrocarpous and pleurocarpous taxa, whether apical or lateral, leave capsules exposed to wind for spore release. Spores liberated in air currents travel variable distances depending on atmospheric conditions, wind speed, spore size, survival, etc. Cleistocarpic species (Delgadillo, 1992) depend on other agents for spore liberation; spores may be released when capsule wall breaks down or is fractured during transportation by cattle hoofs.
Knowledge of the bryofloristic composition of the alpine environment of Mexico has improved, but deserves a finer evaluation; incidental fieldwork in the highlands still leads to discovery of new records (Cárdenas, 1989; Delgadillo, 2020; Greven, 1999; Yip, 2002). Current data offer a significant improvement of our understanding of this alpine moss flora and its distribution patterns, and highlight the usefulness of SDMs for hypothesis-driven ecological research. Specifically, SDMs allowed us to validate our hypothesis on corridor-based species interchange across mountain environments (Delgadillo, 1988, 1998), as well as in identifying key environmental variables shaping species distributions. Enhanced field exploration and ecological modelling research, both in alpine mountain tops and adjacent subalpine areas, could further improve our understanding of the actual distribution ranges of alpine mosses, as well as the mechanisms underpinning them.
Acknowledgements
Thanks are extended to two anonymous reviewers for criticism of a previous version of this article.
References
Aiello-Lammens, M. E., Boria, R. A., Radosavljevic, A., Vilela, B., & Anderson, R. P. (2015). spThin: an R package for spatial thinning of species occurrence records for use in ecological niche models. Ecography, 38, 541–545. https://doi.org/10.1111/ecog.01132
Bartram, E. B. (1945). Alpine mosses from Mexico. Revue Bryologique et Lichénologique, 15, 21–23.
Bartram, E. B. (1949). Alpine mosses from Mexico collected by Walter Kiener. The Bryologist, 52, 23–27.
Beaman, J. H. (1962). The Timberlines of Iztaccihuatl and Popocatepetl, Mexico. Ecology, 43, 377–385. https://doi.org/10.2307/1933367
Benito, B. (2023). “Collinear: R Package for Seamless Multicollinearity Management.” https://doi.org/10.5281/zenodo.10039489
Boyce, M. S., Vernier, P. R., Nielsen, S. E., & Schmiegelow, F. K. A. (2002). Evaluating resource selection functions. Ecological Modelling, 157, 281–300. https://doi.org/10.1016/S0304-3800(02)00200-4
Burnham, K. P., & Anderson, D. R. (2004). Multimodel inference: understanding AIC and BIC in model selection. Sociological Methods & Research, 33,261–304. https://doi.org/10.1177/0049124104268644
Cárdenas S. A. (1989). Nuevos registros para la flora de musgos de México y del Valle de México. Anales del Instituto de Biología, Universidad Nacional Autónoma de México, Serie Botánica, 58, 93–95.
Cardot, J. (1909a). Diagnoses préliminaires de mousses mexicaines. Revue Bryologique, 36, 67–77.
Cardot, J. (1909b). Diagnoses préliminaires de mousses mexicaines. Revue Bryologique, 36, 81–88.
Cardot, J. (1909c). Diagnoses préliminaires de mousses mexicaines. Revue Bryologique, 36, 105–115.
Cardot, J. (1910a). Diagnoses préliminaires de mousses mexicaines. Revue Bryologique, 37, 4–13.
Cardot, J. (1910b). Diagnoses préliminaires de mousses mexicaines. Revue Bryologique, 37, 49–59.
Cardot, J. (1910c). Diagnoses préliminaires de mousses mexicaines. Revue Bryologique, 37, 65–72.
Cardot, J. (1910d). Diagnoses préliminaires de mousses mexicaines. Revue Bryologique, 37, 117–128.
Cardot, J. (1911). Diagnoses préliminaires de mousses mexicaines. Revue Bryologique, 38, 1–9.
Cerrejón, C., Valeria, O., Mansuy, N., Barbé, M., & Fenton, N. J. (2020). Predictive mapping of bryophyte richness patterns in boreal forests using species distribution models and remote sensing data. Ecological Indicators, 119, 106826. https://doi.org/10.1016/j.ecolind.2020.106826
Cerrejón, C., Valeria, O., Muñoz, J., & Fenton, N. J. (2022). Small but visible: predicting rare bryophyte distribution and richness patterns using remote sensing-based ensembles of small models. Plos One, 17, e0260543. https://doi.org/10.1371/journal.pone.0260543
Conabio (Comisión Nacional para el Conocimiento y Uso de la Biodiversidad). (1997). Provincias biogeográficas de México. Retrieved April 19, 2024, from: http://www.conabio.gob.mx/informacion/gis/?vns=gis_root/region/biotic/rbiog4mgw http://geoportal.conabio.gob.mx/descargas/mapas/imagen/96/rbiog4mgw
Delgadillo, M. C. (1971). Phytogeographic studies on alpine mosses of Mexico. The Bryologist, 74, 331–346.
Delgadillo, M. C. (1984). Musgos alpinos de México: Cofre de Perote y Pico de Orizaba. Biótica, 9, 399–405.
Delgadillo, M. C. (1985). The Neovolcanic Belt of Mexico as a barrier and route of migration for mosses. Monographs in Systematic Botany from the Missouri Botanical Garden, 11, 41–44.
Delgadillo, M. C. (1987). Moss distribution and the phytogeographical significance of the Neovolcanic Belt of Mexico. Journal of Biogeography, 14, 69–78. http://dx.doi.org/10.2307/2844787
Delgadillo, M. C. (1988). Floristic corridors for moss distribution across the Neovolcanic Belt of Mexico. I. The Tuxpan corridor. Journal of Bryology,15,165–175. http://dx.doi.org/10.1179/jbr.1988.15.1.165
Delgadillo, M. C. (1992). Floristic corridors for moss distribution across the Neovolcanic Belt of Mexico. II. The cleistocarpic species. Journal of Bryology, 17, 313–316. http://dx.doi.org/10.1179/jbr.1992.17.2.313
Delgadillo, M. C. (1998). Floristic corridors for moss distribution across the Neovolcanic Belt of Mexico. III. The Michoacán corridors. Journal of Bryology,20, 27–39. http://dx.doi.org/10.1179/jbr.1998.20.1.27
Delgadillo, M. C. (2009). Floristic corridors for moss distribution across the Neovolcanic Belt of Mexico. IV. The Toluca and Chalco corridors. Journal of Bryology,31, 30-40. http://dx.doi.org/10.1179/174328209×404907
Delgadillo, M. C. (2015). Grimmia (Grimmiaceae, Bryophyta) in the Neotropics. Ciudad de México: Instituto de Biología, UNAM.
Delgadillo, M. C. (2020). Two disjunct moss species new to Mexico. Cryptogamie, Bryologie, 41, 83–87.
Delgadillo, M. C., Bello, B., & Cárdenas, S., A. (1995). LATMOSS, a catalogue of Neotropical mosses.
Monographs in Systematic Botany from the Missouri Botanical Garden, 56, 1–191.
Delgadillo, M. C., & Peña-Retes, A. P. (2017). Moss diversity in the state of Aguascalientes: revision and update.
Botanical Sciences, 95, 503–513. http://doi.org/10.17129/botsci.891
Delgadillo, M. C., & Pérez-Bandín, E. (1982). Spore liberation in mosses. I. Problems and perspectives of wind tunnel experiments. Cryptogamie: Bryologie et Lichénologie, 3, 39–49.
Dormann, C. F., Elith, J., Bacher, S., Buchmann, C., Carl, G., Carré, G. et al. (2012). Collinearity: a review of methods to deal with it and a simulation study evaluating their performance. Ecography, 36, 27–46. https://doi.org/10.1111/j.1600-0587.2012.07348.x
Fielding, A. H. & Bell, J. F. (1997). A review of methods for the assessment of prediction errors in conservation presence/absence models. Environmental Conservation, 24, 38–49. https://doi.org/10.1017/S0376892997000088
Franklin, J. (2010). Mapping species distributions: spatial inference and prediction. Cambridge: Cambridge University Press.
Freeman, E. A., & Moisen, G. G. (2008). A comparison of the performance of threshold criteria for binary classification in terms of predicted prevalence and kappa. Ecological Modelling, 217, 48–58. https://doi.org/10.1016/j.ecolmodel.2008.05.015
Gorelick, N., Hancher, M., Dixon, M., Ilyushchenko, S., Thau, D., & Moore, R. (2017). Google Earth Engine: planetary scale geospatial analysis for everyone. Remote Sensing of Environment, 202, 18–27. https://doi.org/10.1016/j.rse.2017.06.031
Greven, H. C. (1999). A synopsis of Grimmia in Mexico, including Grimmia mexicana, sp. nov. The Bryologist, 102, 426–436. https://doi.org/10.2307/3244231
Guillera-Arroita, G., Lahoz-Monfort, J. J., Elith, J., Gordon, A., Kujala, H., Lentini, P. E. et al. (2015). Is my species distribution model fit for purpose? Matching data and models to applications. Global Ecology and Biogeography, 24,276–292. https://doi.org/10.1111/geb.12268
Harrell, F. E., Lee, K. L., & Mark, D. B. (1996). Tutorial in biostatistics multivariable prognostic models: issues in developing models, evaluating assumptions and adequacy, and measuring and reducing errors. Statistics in Medicine, 15, 361–387. https://doi.org/10.1002/(SICI)1097-0258(19960229)15:4<361::AID-SIM168>3.0.CO;2-4
Hijmans, R. J., Barbosa, M., Ghosh, A., & Mandel, A. (2024). geodata: Download Geographic Data. R package version 0.6-2. https://CRAN.R-project.org/package=geodata
Hirzel, A. H., Le Lay, G., Helfer, V., Randin, C., & Guisan, A. (2006). Evaluating the ability of habitat suitability models to predict species presences. Ecological Modelling, 199, 142–152. https://doi.org/10.1016/j.ecolmodel.2006.05.017
Hooker, W. J. (1818). Musci Exotici; containing figures and descriptions of new or little-known foreign mosses and other cryptogamic subjects, Vol. 1. London: Longman, Hurst, Orme and Brown. https://doi.org/10.5962/bhl.title.10721
Hooker, W. J. (1820). Musci Exotici; containing figures and descriptions of new or little-known foreign mosses and other cryptogamic subjects, Vol. 2. London: Longman, Hurst, Orme and Brown. https://doi.org/10.5962/bhl.title.10721
Jiménez-Valverde, A., & Lobo, J. M. (2007). Threshold criteria for conversion of probability of species presence to either–or presence–absence. Acta Oecologica, 31, 361–369. https://doi.org/10.1016/j.actao.2007.02.001
Kass, J. M., Muscarella, R., Galante, P. J., Bohl, C. L., Pinilla-Buitrago, G. E., Boria, R. A. et al. (2021). ENMeval 2.0: Redesigned for customizable and reproducible modeling of species’ niches and distributions. Methods in Ecology and Evolution, 12,1602–1608. https://doi.org/10.1111/2041-210X.13628
Kutner, M. H., Nachtsheim, C. J., Neter, J., & Li, W. (2005). Applied linear statistical models, 5th Ed. Boston: McGraw-Hill.
Mastretta-Yanes, A., Moreno-Letelier, A., Piñero, D., Jorgensen, T. H., & Emerson, B. C. (2015). Biodiversity in the Mexican highlands and the interaction of geology, geography and climate within the Trans-Mexican Volcanic Belt. Journal of Biogeography, 42, 1586–1600. https://doi.org/10.1111/jbi.12546
Mateo, R. G., Felicisimo, A. M., & Muñoz, J. (2011). Species distributions models: a synthetic revision. Revista Chilena de Historia Natural, 84, 217–240. http://dx.doi.org/10.4067/S0716-078X2011000200008
Peduzzi, P., Concato, J., Kemper, E., Holford, T. R., & Feinstein, A. R. (1996). A simulation study of the number of events
per variable in logistic regression analysis. Journal of Clinical Epidemiology, 49, 1373–1379. https://doi.org/10.1016/S0895-4356(96)00236-3
Phillips, S. J., Anderson, R. P., Dudík, M., Schapire, R. E., & Blair, M. E. (2017). Opening the black box: an open-source release of Maxent. Ecography, 40, 887–893. https://doi.org/10.1111/ecog.03049
Phillips, S. J., Anderson, R. P., & Schapire, R. E. (2006). Maximum entropy modeling of species geographic distributions. Ecological Modelling, 190, 231–259. https://doi.org/10.1016/j.ecolmodel.2005.03.026
Phillips, S. J., & Dudík, M. (2008). Modeling of species distributions with Maxent: new extensions and a comprehensive evaluation. Ecography, 31, 161–175. https://doi.org/10.1111/j.2007.0906-7590.05203.x
Proctor, M. C. F. (1979). Structure and eco-physiological adaptation in bryophytes. In G. C. S. Clarke, & J. G. Duckett (Eds.), Bryophyte systematics (pp. 479–509). New York: Academic Press.
Proctor, M. C. F. (1984). Structure and ecological adaptation. In A. F. Dyer, & J. G. Duckett (Eds.), The experimental biology of bryophytes (pp. 9–37). New York: Academic Press.
R Development Core Team (2023). R: a language and environment for statistical computing. R Foundation for Statistical Computing, Vienna, Austria. https://www.R-project.org/
Richardson, D. H. S. (1981). Capsules and spore dispersal. In D. H. S Richardson (Ed.), The Biology of mosses (pp. 61–85). Oxford: Blackwell Scientific Publications.
Sharp, A. J, Crum, H., & Eckel, P. M. (Eds.). (1994). The moss flora of Mexico. Memoirs of the New York Botanical Garden, 69, 1–1113.
Thériot, I. (1921). Mousses du Mexique. Paris: Recueil des Publications de la Société Havraise D’Études Diverses.
Thériot, I. (1931). Quelques nouveautés bryologiques pour le Mexique.Travaux Cryptogamiques Dédiés à Louis Mangin, 7–10.
Thériot, I. (1933). Mexican mosses. IV. Revue Bryologique et Lichénologique, 5, 91–110.
Vanderpuye, A. W., Elvebakk, A., & Nilsen, L. (2002). Plant communities along environmental gradients of high-arctic mires in Sassendalen. Svalbard. Journal of Vegetation Science, 13, 875–884.
Wyatt, R., & Anderson, L. E. (1984). Breeding systems in bryophytes.In A. F. Dyer, & J. G. Duckett (Eds.), The experimental Biology of bryophytes (pp. 39–64). New York: Academic Press.
Wang, Z., Pi, C., Bao, W., & Bader, M. Y. (2022). Elevational trends in photosynthetic capacity and trait relationships of subtropical montane understorey bryophytes. Ecological Indicators,142, 109251. https://doi.org/10.1016/j.ecolind.2022.109251
Warren, D. L., & Seifert, S. N. (2011). Ecological niche modeling in Maxent: the importance of model complexity and the performance of model selection criteria. Ecological Applications, 21, 335–342. https://doi.org/10.1890/10-1171.1
Yip, K. L. (2002). Pseudephemerum, new to the United States and Mexico. The Bryologist, 105, 256–258.


