
Knowledge shortfalls and the effect of wildfireson biodiversity conservation in Guanajuato, Mexico
Tania Escalante a, *, Michelle Farfán b, Oscar Campos a, Leticia M. Ochoa-Ochoa c, Karen Flores-Quintal a, Diego R. García-Vélez a, Ana L. Medina-Bárcenas a, Fernando Saenz a
a Universidad Nacional Autónoma de México, Facultad de Ciencias, Grupo de Biogeografía de la Conservación, Circuito Exterior s/n, Ciudad Universitaria, Coyoacán, 04510 Mexico City, Mexico
b Universidad de Guanajuato, Campus Guanajuato, División de Ingenierías, Departamento de Ingeniería Geomática e Hidráulica, Av. Juárez No. 77, Zona Centro, 36000 Guanajuato, Guanajuato, Mexico
c Universidad Nacional Autónoma de México, Facultad de Ciencias, Departamento de Biología Evolutiva, Museo de Zoología “Alfonso L. Herrera”, Circuito Exterior s/n, Ciudad Universitaria, Coyoacán, 04510 Mexico City, Mexico
*Corresponding author: tescalante@ciencias.unam.mx (T. Escalante)
Received: 01 August 2023; accepted: 29 February 2024
Abstract
Knowledge of shortfalls could modify the geographic distribution patterns and limit the actions to conserve the biodiversity, even in the taxa best known. In addition, forest fires also could modify those patterns, but the potential effects of both factors have not been tested. Our aim was to analyze the effect of the Linnean and Wallacean shortfalls in the first evaluation of wildfire impacts on 22 amphibian and 13 mammal species distributed in Guanajuato, Mexico. We evaluated those shortfalls using the non-parametric estimator Chao2 and the Qs estimator and through maps of species richness patterns. To evaluate the effects of wildfires, we produced a fire recurrence map and quantified the burned area within species distributions and in 24 Protected Natural Areas (PNA) in the state. The Linnean shortfall showed some species missing to record in Guanajuato for both taxa, while the Wallacean shortfall showed poor quality of knowledge. Fire recurrence was high within 5 PNA. The richness patterns affected by fires covered nearly 17% of the surface of Guanajuato. Improving the knowledge of biogeographical patterns could provide better tools to stakeholders to decrease the negative impact of fires within PNA.
Keywords: Fire; Patterns; Priorities; Richness; Species distribution models
© 2024 Universidad Nacional Autónoma de México, Instituto de Biología. Este es un artículo Open Access bajo la licencia CC BY-NC-ND
(http://creativecommons.org/licenses/by-nc-nd/4.0/).
Déficits de conocimiento y el efecto de los incendios forestales en la conservación de la biodiversidad en Guanajuato, México
Resumen
Los déficits en el conocimiento podrían modificar los patrones de distribución geográfica y limitar las acciones para conservar la biodiversidad, incluso en taxones bien conocidos. Además, los incendios forestales también pueden modificar esos patrones, pero los efectos potenciales de ambos no han sido probados. Nuestro objetivo fue analizar el efecto de los déficits Linneano y Wallaceano en la primera evaluación de los impactos de los incendios forestales en 22 especies de anfibios y 13 de mamíferos en Guanajuato, México. Evaluamos esos déficits utilizando los estimadores Chao2 y Qs y con mapas de riqueza de especies. Para evaluar los efectos de incendios forestales, elaboramos un mapa de recurrencia de incendios y cuantificamos el área quemada dentro de las distribuciones de las especies y en 24 áreas naturales protegidas (ANP). El déficit Linneano mostró que faltan algunas especies por registrar para ambos taxones, mientras que el déficit Wallaceano mostró una mala calidad de conocimiento. La recurrencia de incendios fue alta dentro de 5 ANP. Los patrones de riqueza afectados por los incendios cubrieron cerca de 17% de la superficie de Guanajuato. Mejorar el conocimiento de los patrones biogeográficos brindará mejores herramientas para disminuir el impacto de los incendios dentro de las ANP.
Palabras clave: Fuego; Patrones; Prioridades; Riqueza; Modelos de distribución de especies
Introduction
Terrestrial vertebrates are among the best known taxonomic groups, and it is assumed that their distributional areas and their biogeographic patterns are equally well known. However, there are shortfalls that could mask the distributional patterns and therefore, bias the actions to conserve those patterns. Linnean and Wallacean shortfalls affect our knowledge and lead to inaccurate representations of the species richness patterns in taxonomic groups that are presumed to be well known. The Linnean shortfall refers to the discrepancy between formally described species and the number of species that actually exist, while the Wallacean shortfall is the lack of knowledge about the geographical distribution of the species (Hortal et al., 2015; Lomolino, 2004). Both the Linnean and the Wallacean shortfalls can be difficult to evaluate, and they are rarely quantified in the literature prior to a conservation prioritization analysis. For example, to our knowledge, they have never been taken into account when analyzing the effects of wildfires on biodiversity.
Throughout the history of the Earth, fire has been a natural process that has driven the configuration of ecosystems and the maintenance of biodiversity around the world (He et al., 2019; Kelly et al., 2020). Indeed, there are many terrestrial ecosystems that are prone to fire and whose composition and structure are controlled by fire, leading to their classification as fire-adapted ecosystems (He et al., 2019; Schlisky et al., 2007). However, the forest fire regime has been altered by human dynamics associated with fire management and land use change at local and global scales (Chuvieco et al., 2008; Farfán et al., 2018; Martínez-Torres et al., 2015). Several authors agree that there is an increase in the occurrence of wildfires globally (Kelly et al., 2020). Places that did not burn naturally are now burning; examples include the tropical forests of Southeast Asia (Chisholm et al., 2016) and South America (Barlow et al., 2020) to the tundra of the Arctic Circle (Hu et al., 2015). Given the magnitude at which fires are occurring, it has even been proposed that the current era should be coined the Pyrocene, the “age of fire” (Pyne, 2021). This has led to the current situation in which frequency and intensity of forest fires pose a threat to biodiversity conservation worldwide and to human societies; this is due to the damage they cause but also by contributing to global warming.
In Mexico, the effects of wildfires on the fauna are poorly documented. Salazar et al. (2019) proposed a map (scale 1:50,000) of the severity of the fires in the state of Guanajuato for 2017, 2018 and 2019, by calculating the area of burned forest within each of 3 degrees of damage severity: low moderate, high moderate and high. They estimated the total burned area in Guanajuato at 8,460 ha in 2017; 19,589 ha in 2018; and 52,713 ha in 2019 (Salazar et al., 2019). Recently, Farfán et al. (2021) produced a map predicting the occurrence of fires in Guanajuato based on climatic variables under ENSO conditions using a spatial model. They observed that wildfires do not occur in random locations; rather, they are more likely to occur when fragmented forest is immersed in an agricultural matrix, as is frequently the case in the southern part of the state (Farfán et al., 2021).
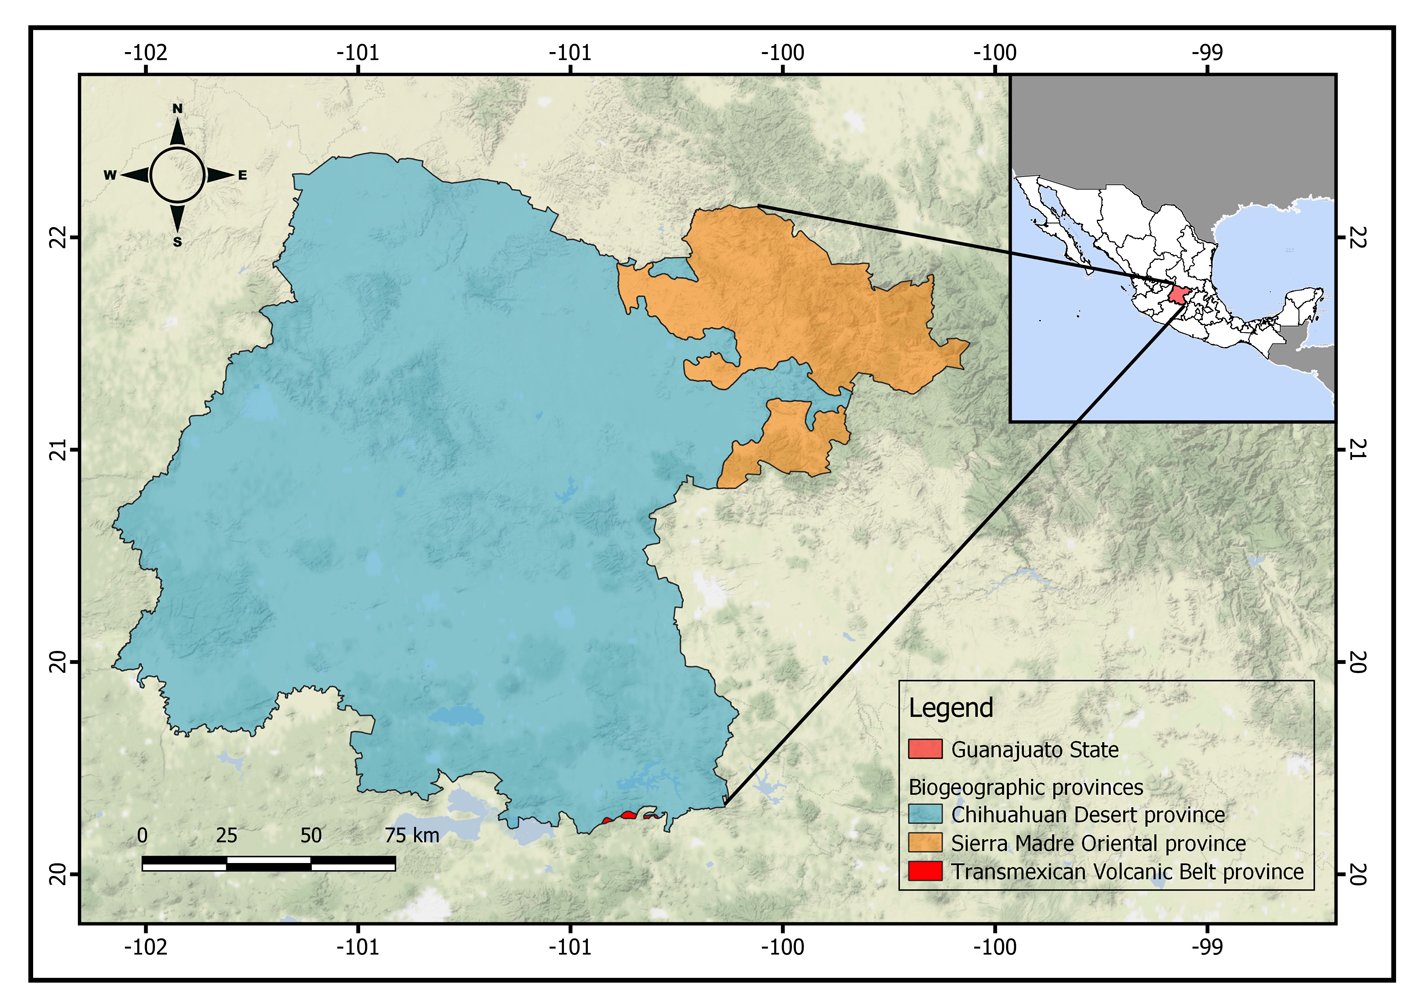
Figure 1. Location of the state of Guanajuato, Mexico, showing the biogeographic provinces.
Amphibians have been recognized as the most threatened terrestrial vertebrate class (Luedtke et al., 2023), and mammals could have significant declination in their populations due to fire, like in Australia (Geary et al., 2023). However, responses of animals to fire could be diverse because they are strongly related to their life-history traits (González et al., 2021). The responses of the amphibian species are variable and incompletely understood (Pilliod et al., 2003); while even among mammalian species, the effect of fire could be not consistent (González et al., 2021). Therefore, the effect of wildfires on distributional patterns of these taxa could be different.
In this study, our aim is to analyze the Linnean and Wallacean shortfalls in the context of the first evaluation of wildfire impacts on biodiversity. We use species of amphibians and mammals of Guanajuato, Mexico, as a study model and use the results to propose priority areas for conservation.
Material and methods
The state of Guanajuato is located in central Mexico, at 19°55’- 21°51’ N, 99°40’ – 102°06’ W. Most of the state is in the Chihuahuan Desert province, with a few areas in Sierra Madre Oriental and Transmexican Volcanic Belt provinces (Morrone et al., 2017; Fig. 1). Guajanuato has 24 Protected Natural Areas (PNA) mainly located in the southwest and center of the state. The largest of these areas is a biosphere reserve (Sierra Gorda), and the other PNA have a range of different levels of protection and activities allowed (SMAOT, 2022).
Although Guanajuato is not among the most biodiverse states in Mexico, it harbors a wide variety of ecosystems, from Pinus and Quercus forests to xerophytic scrubs (Conabio, 2012). Unfortunately, the extent of the agricultural and livestock areas, the high population density, the expansion of urban areas, and industrial activities have contributed to the destruction and disappearance of the original vegetation (Conabio, 2012).
Guanajuato harbors a total of 27 reported species of amphibians and 93 species of mammals, 8 and 25 of which, respectively, have been described as conservation priorities (DOF, 2010; Leyte-Manrique et al., 2022; Sánchez et al., 2016). Of all the species of amphibians and mammals inhabiting Guanajuato, we chose 22 species of amphibians and 13 species of mammals (Table 1) based on the following criteria: 1) valid nomenclature and at least one point record located in Guanajuato in the consulted databases (Flores-Villela & Ochoa-Ochoa, 2020; Escalante et al., 2018; GBIF.org, 2020a-ah); 2) geographic distribution mostly contained within Mexico; 3) at least 25 point records throughout the whole distribution in order to generate reliable species distribution models (SDM); and 4) considered conservation priorities.
In order to evaluate the Linnean and Wallacean shortfalls for those species, we searched the aforementioned databases for all valid point records in Guanajuato. These were initially overlapped to a grid of 0.25º latitude × 0.25º longitude, in QGIS v.3.16.16 (QGIS Development Team, 2020), which will be referred to hereafter as the “state scale”. We built a presence-absence matrix using the generated SDM.
To evaluate the Linnean shortfall based on point records, we quantified the observed richness (Sobs) as the recorded number of species of amphibians and mammals in each quadrat of 0.25º based on locality records. Then, we used the non-parametric estimator Chao2 in R (Kindt & Coe, 2005), to estimate the asymptotic richness of the incidence dataset (Gotelli & Colwell, 2011). The estimated richness Sest in Chao2 was obtained by the formula (Colwell & Coddington, 1994): Sest = Sobs + L2/(2M), where L = number of species that occur in only 1 quadrat, and M = number of species that occur in exactly 2 quadrats. Thus, this calculation provided a measure of how well the richness of each taxonomic group is known for those areas. We also performed the same analysis based on the species distribution models to explore how well the Linnean shortfall was corrected.
Table 1
List of species of amphibians and mammals in Guanajuato, Mexico, and data used in the analyses. Total records = number of point records after the nomenclatural and geographic validation (state scale). Records in Guanajuato = number of point records of each species into the geopolitical boundaries of the state of Guanajuato. Filtered records = subset of point records after the filter of 10 km applied to the total records. Records for modeling = subset of the filtered records used for model training. pROC = ROC partial of the best model.
| Species | Total records | Records in Guanajuato | Filtered records | Records for modeling | pROC |
| Amphibians | |||||
| Ambystoma velasci | 259 | 45 | 247 | 23 | 1.81 |
| Anaxyrus compactilis | 561 | 31 | 488 | 41 | 1.72 |
| Anaxyrus punctatus | 3,798 | 29 | 3,405 | 226 | 1.76 |
| Aquiloeurycea cephalica | 258 | 2 | 227 | 18 | 1.74 |
| Craugastor augusti | 599 | 16 | 508 | 54 | 1.58 |
| Dryophytes arenicolor | 2,514 | 138 | 2,269 | 161 | 1.81 |
| Dryophytes eximius | 820 | 19 | 761 | 72 | 1.75 |
| Eleutherodactylus guttilatus | 136 | 20 | 109 | 12 | 1.79 |
| Eleutherodactylus nitidus | 673 | 5 | 556 | 48 | 1.68 |
| Eleutherodactylus verrucipes | 237 | 2 | 167 | 13 | 1.52 |
| Hypopachus variolosus | 1,323 | 10 | 1,122 | 116 | 1.74 |
| Incilius nebulifer | 5,585 | 13 | 5,200 | 256 | 1.83 |
| Incilius occidentalis | 1,620 | 81 | 1,342 | 114 | 1.71 |
| Isthmura belli | 245 | 1 | 232 | 18 | 1.64 |
| Lithobates berlandieri | 3,747 | 51 | 3,401 | 247 | 1.56 |
| Lithobates megapoda | 127 | 9 | 101 | 12 | 1.65 |
| Lithobates montezumae | 696 | 94 | 598 | 51 | 1.75 |
| Lithobates neovolcanicus | 349 | 51 | 298 | 32 | 1.68 |
| Lithobates spectabilis | 544 | 3 | 416 | 40 | 1.64 |
| Rheohyla miotympanum | 383 | 1 | 329 | 27 | 1.60 |
| Smilisca baudinii | 4,381 | 2 | 3,590 | 277 | 1.68 |
| Spea multiplicata | 2,251 | 38 | 2,008 | 196 | 1.79 |
| Total | 31,090 | 661 | 27,374 | 2,054 | |
| Mammals | |||||
| Choeronycteris mexicana | 578 | 5 | 384 | 72 | 1.71 |
| Corynorhinus mexicanus | 204 | 4 | 149 | 28 | 1.79 |
| Dipodomys ornatus | 85 | 2 | 61 | 12 | 1.78 |
| Table 1. Continued | |||||
| Species | Total records | Records in Guanajuato | Filtered records | Records for modeling | pROC |
| Leptonycteris nivalis | 263 | 1 | 179 | 34 | 1.66 |
| Leptonycteris yerbabuenae | 575 | 9 | 370 | 70 | 1.75 |
| Lepus callotis | 199 | 6 | 150 | 28 | 1.75 |
| Peromyscus melanotis | 601 | 3 | 227 | 42 | 1.84 |
| Peromyscus difficilis | 897 | 10 | 453 | 85 | 1.69 |
| Peromyscus melanophrys | 594 | 25 | 372 | 70 | 1.59 |
| Rhogeessa alleni | 55 | 5 | 46 | 8 | 1.60 |
| Sciurus oculatus | 123 | 34 | 73 | 14 | 1.45 |
| Sigmodon leucotis | 103 | 9 | 72 | 14 | 1.50 |
| Sorex saussurei | 168 | 1 | 93 | 18 | 1.8 |
| Total | 4,445 | 114 | 2,629 | 495 |
To quantify the Wallacean shortfall, we used the Qs estimator (Murguía-Romero & Villaseñor, 2000), which is a measure of the quality of the records. QS can take values between ‘0’ and ‘1’ and is defined as (Murguía-Romero & Villaseñor, 2000): QS = F/[Sobs m/(1 – Es) – max (Sobs, m)], where F = the sum of frequencies of all classes multiplied by all classes (that is, the sum of all ‘1’ in the matrix); Es = measure of the proportion of the known richness related to the estimated richness; and m = the total number of quadrats. Murguía-Romero and Villaseñor (2000) characterized QS values above 80% as “very good”, values between 50% to 80% as “good” and less than 50% as “poor” data quality.
To compare the possible effect of the Wallacean shortfall in the biogeographic patterns, we performed a species distribution model (SDM) for each species in order to obtain a map of richness patterns for amphibians and mammals. Following the BAM diagram of Soberón and Peterson (2005), where the M corresponds to the region that is reachable by the species from established distributional areas in ecological time (Soberón & Peterson, 2005). The M for each species was obtained using the concept of extent of occurrence, defined as “the area contained within the shortest continuous imaginary boundary that can be drawn to encompass all the known, inferred or projected sites of present occurrence of a taxon, excluding cases of vagrancy” (IUCN, 2001). Therefore, we defined M as the area within a minimum convex hull polygon for each species constructed in QGIS v.3.16.16 (QGIS Development Team, 2020).
The M of each species was used to crop the 19 environmental layers of WorldClim 2 (Fick & Hijmans, 2017) and 3 topographic variables (slope, elevation and aspect; USGS, 2021) at ~ 1 km2 of resolution. The data points were filtered in Wallace software (Kass et al., 2018) to a distance of 10 km between points to reduce spatial biases, and retain useful information (Aiello-Lammens et al., 2015; Pearson et al., 2007). To avoid collinearity among the 22 variables for each species, we obtained the VIF (Mandeville, 2008; Montgomery & Peck, 1992), applying the packages usdm (Naimi et al., 2014) and rgdal (Bivand et al., 2015) in RStudio (RStudio Team, 2020).
The models were performed in the maximum entropy package kuenm (Cobos et al., 2019) in RStudio (RStudio Team, 2020). The occurrence dataset for each species was divided as follows: 75% of the points were used for training and 25% for testing; and a set of independent occurrences of 25% for a last evaluation; those datasets were built with the kuenm_occsplit function in kuenm. For the next step, we used the function kuenm_cal, using the feature classes: linear, quadratic and hinge; and the regularization multipliers 0.5, 1, 1.5, 2, 2.5, 3, 3.5 and 4. All models were evaluated with kuenm_ceval, calculating the ROC partial with E = 10 (Peterson et al., 2008), and Akaike criterion for small samples (AICc; Warren & Seifert, 2011). The final best model for each species was obtained on a clog-log scale using the pROC value in NicheToolbox (Osorio-Olvera et al., 2020).
To produce binary maps of geographic distribution area of each species, the final best model was reclassified using the “10th percentile training presence” threshold, and cropped to the political boundaries of Guanajuato.
Wildfires. We used hotspot data from the MODIS sensor at a resolution of 1 km2 for the years 2000 to 2021, downloaded from NASA Earth Data Cloud (2020). Each hotspot was overlapped to a net of ~ 1 km2 covering the state of Guanajuato in QGIS (QGIS Development Team, 2020), and we counted the number of hotspots in each square of the net. This area will be referred to as the “fine scale”.
In order to compare the number of fires in each square of the net with the scale of the models, we transformed this number between ‘0’ and ‘1’ through a min-max normalization (Farrús et al., 2007; Jain et al., 2005). This procedure was useful to evaluate the effect of the wildfires on the SDM of each species. All cartographic products were projected to UTM zone 14 north coordinates, which corresponds to the state of Guanajuato. To quantify the impact of the fires on species richness patterns, we rasterized the map of the number of fires, from which we produced a new map of kernel density with a radius of 3,000 m, using the software DINAMICA EGO (Ferreira et al., 2019). The map of kernel density was multiplied by the richness map for each taxonomic group. Finally, we quantified the burned area for the maps and for the Protected Natural Areas (SMAOT, 2022).
Results
Shortfalls. We obtained 31,090 records of amphibians considering the whole distribution for the 22 amphibian species, and 661 records within Guanajuato. For the 13 species of mammals, the number of records was 74 in Guanajuato and 2,629 in the whole distribution. The species with the most records was the coastal plain toad Incilius nebulifer (5,585 records) for the amphibians and the southern rock mouse Peromyscus difficilis (453 records; see Table 1) for the mammals. However, within Guanajuato, there were only 13 and 9 records for these species, respectively. The species with the highest number of point records within Guanajuato were the canyon tree frog Dryophytes arenicolor with 138 records, and the Peters’s squirrel Sciurus oculatus, with 34 records.
The richest 0.25º quadrat for amphibians had 11 species and the quadrat with the most mammals had 5 species, while the lowest number of species per quadrat was 1 for both taxa, although there were a few marginal quadrats without data for amphibians and some complete quadrats without data for mammals (~ 12). The maps of quadrats with the observed richness (Sobs in Chao2) for both groups are shown in the Supplementary material: figures 1S, 2S. The main results of the Chao2 estimator are shown in Table 2. For both groups, the number of observed species (Sobs) was lower than the expected number (Sest) for Guanajuato. In the case of the Chao2 estimated with species distribution models, the species richness was the same as the expected species.
Regarding the Wallacean shortfall, the Qs estimator had a value of 23% for the amphibians and 28% for mammals at the state scale. These values were categorized as “poor” quality data in both taxa, but Qs was worse in amphibians.
Table 2
Results of the recorded and estimated richness for the complete distributional data of amphibians and mammals of Guanajuato, Mexico based both on species richness and on species distribution models (SDM).
| Taxonomic group | Recorded richness (Sobs) | Estimated richness (Sest) | Standard deviation (SD) | Estimated richness with SDM (Sest) |
| Amphibians | 22 | 24.61 | 3.42 | 24 |
| Mammals | 13 | 14.94 | 3.64 | 14 |

Figure 2. Richness pattern for 22 modeled species of amphibians and the Protected Natural Areas in Guanajuato, Mexico (black polygons): 1. Palenque, 2. Peña Alta, 3. Sierra de Pénjamo, 4. Sierra de los Agustinos, 5. Las Fuentes, 6. Sierra de Lobos, 7. Las Musas, 8. Lago Cráter La Joya, 9. Cerro de los Amoles, 10. Parque Metropolitano, 11. Cerro de Arandas, 12. Cuenca Alta del Río Temascatio, 13. Cerro del Cubilete, 14. Cerros El Culiacán y La Gavia, 15. Cuenca de La Esperanza, 16. Mega Parque de la Ciudad de Dolores Hidalgo, 17. Presa La Purísima y su Zona de Influencia, 18. Presa de Neutla y su Zona de Influencia, 19. Laguna de Yuriria y su Zona de Influencia, 20. Pinal de Zamorano, 21. Región Volcánica Siete Luminarias, 22. Sierra Gorda de Guanajuato, 23. Cuenca de la Soledad, 24. Presa de Silva y Áreas Aledañas.
Some results of the modeling process are shown in Table 1. The distribution models of amphibians predicted that the species Craugastor augusti, Dryophytes arenicolor, Dryophytes eximius, Incilius occidentalis, Lithobates montezumae, Lithobates neovolcanicus, and Spea multiplicata are distributed in more than 90% of the surface of Guanajuato. Meanwhile, the species Aquiloeurycea cephalica (31%), Smilisca baudini (25%), Lithobates berlandieri (19%), and Incilius nebulifer (3%) had the lowest proportion of distribution in Guanajuato. Regarding the mammals, Choeronycteris mexicana, Corynorhynus mexicanus, Leptonycteris nivalis, Lepus callotis, Peromyscus difficilis, Peromyscus melanophrys, and Peromyscus melanotis were the most widely distributed in Guanajuato (more than the 90% of the state is predicted as part of their distribution), while Sorex saussurei was the only species with a proportion less than 30%.
For the richness patterns, the pixels with highest number of species modeled to be present were similar between amphibians and mammals at the fine scale (Figs. 2, 3), showing a diagonal strip of high richness from the northwest to the southeast, which coincided with 14 PNA: Las Fuentes, Sierra de Lobos, Parque Metropolitano, Cuenca Alta del Río Temascatío, Cerro del Cubilete, Cuenca de La Esperanza, Presa de Neutla, Cuenca de la Soledad, Sierra de los Agustinos, Lago Cráter La Joya, Cerro de los Amoles, Cerros El Culiacán y La Gavia, Laguna de Yuriria and Región Volcánica Siete Luminarias. There were also other sites of high diversity, for example within the PNA of Sierra de Pénjamo and Sierra Gorda.
Wildfires. The maximum number of wildfires per quadrant at the fine scale was 6. To further explore the risk of wildfire recurrence, we built a risk map using the recurrence of fires in each square, with 3 classes: 1) low risk, for pixels with one fire during the analyzed period; 2) medium risk, for pixels with 2 or 3 fires; and 3) high risk, for pixels with 4, 5 or 6 fires (Fig. 4). A large proportion of quadrats with high recurrence of fires occurred outside PNA (for example at northern Guanajuato), but there were also some high risk zones within PNA, like Palenque, Peña Alta, Sierra de Pénjamo, Las Musas and Región Volcánica Siete Luminarias.

Figure 3. Richness pattern for 13 modeled species of mammals and the Protected Natural Areas in Guanajuato, Mexico (black polygons): 1. Palenque, 2. Peña Alta, 3. Sierra de Pénjamo, 4. Sierra de los Agustinos, 5. Las Fuentes, 6. Sierra de Lobos, 7. Las Musas, 8. Lago Cráter La Joya, 9. Cerro de los Amoles, 10. Parque Metropolitano, 11. Cerro de Arandas, 12. Cuenca Alta del Río Temascatio, 13. Cerro del Cubilete, 14. Cerros El Culiacán y La Gavia, 15. Cuenca de La Esperanza, 16. Mega Parque de la Ciudad de Dolores Hidalgo, 17. Presa La Purísima y su Zona de Influencia, 18. Presa de Neutla y su Zona de Influencia, 19. Laguna de Yuriria y su Zona de Influencia, 20. Pinal de Zamorano, 21. Región Volcánica Siete Luminarias, 22. Sierra Gorda de Guanajuato, 23. Cuenca de la Soledad, 24. Presa de Silva y Áreas Aledañas.
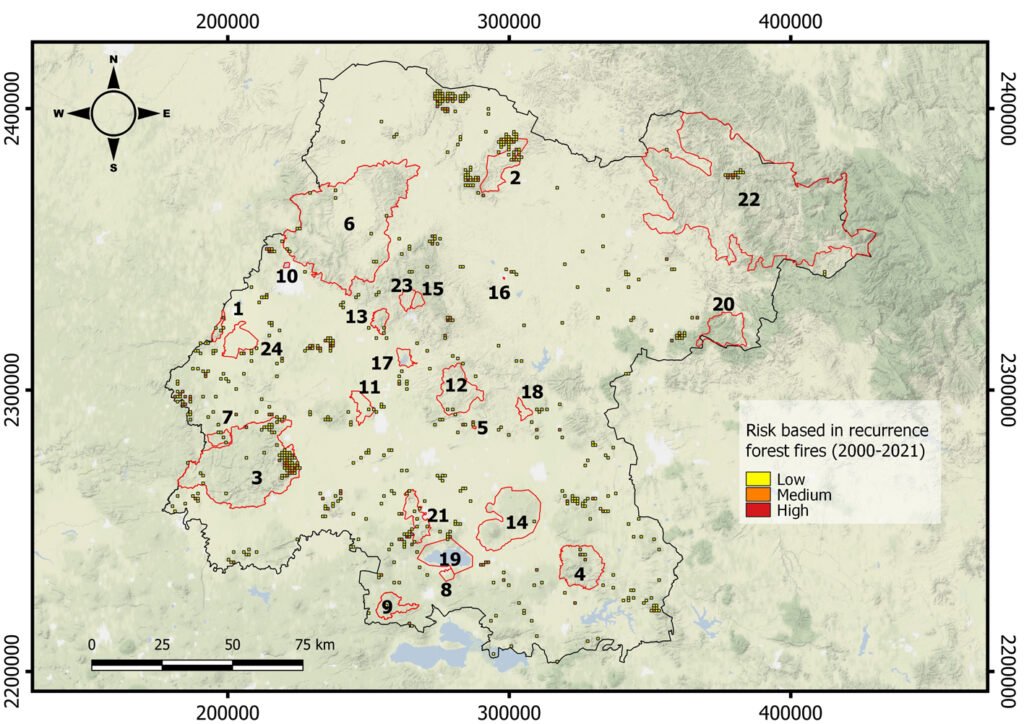
Figure 4. Map of fire risk in Guanajuato between the years 2000 and 2021, based on the recurrence of fires in a 1 km square, with 3 classes: (1) low risk, for squares with one fire during the analyzed period; (2) medium risk, for squares with 2 or 3 fires; and (3) high risk, for squares with 4, 5 or 6 fires. Red polygons represent the Protected Natural Areas.
Table 3
Potential distribution area predicted by the modeling for 22 amphibian and 13 mammal species and quantification of habitat lost due to wildfires relative to the total area of Guanajuato, Mexico (30,702 km2).
| Species | Surface of potential distribution area occupied in Guanajuato (km2) | Percentage of potential distribution area occupied (%) | Surface of potential distribution area affected by wildfires (km2) | Percentage of potential distribution area affected by wildfires (%) |
| Amphibians | ||||
| Ambystoma velasci | 22,351 | 73 | 3,620 | 16 |
| Anaxyrus compactilis | 26,061 | 85 | 4,948 | 19 |
| Anaxyrus punctatus | 18,241 | 59 | 2,440 | 13.3 |
| Aquiloeurycea cephalica | 9,653 | 31 | 1,246 | 12.9 |
| Craugastor augusti | 30,702 | 100 | 5,264 | 17.1 |
| Dryophytes arenicolor | 30,696 | 99.9 | 5,262 | 17.1 |
| Dryophytes eximius | 30,267 | 98.5 | 5,249 | 17.3 |
| Eleutherodactylus guttilatus | 21,636 | 70 | 2,088 | 14.2 |
| Eleutherodactylus nitidus | 22,888 | 75 | 4,663 | 20.3 |
| Eleutherodactylus verrucipes | 20,519 | 67 | 2,756 | 13.4 |
| Hypopachus variolosus | 19,076 | 62 | 3,951 | 20.7 |
| Incilius nebulifer | 873 | 3 | 55 | 6.3 |
| Incilius occidentalis | 30,546 | 99 | 5,257 | 17.2 |
| Isthmura bellii | 26,647 | 87 | 4,925 | 18.4 |
| Lithobates berlandieri | 5,772 | 19 | 614 | 10.6 |
| Lithobates megapoda | 20,866 | 68 | 4,422 | 21.1 |
| Lithobates montezumae | 29,957 | 97.5 | 5,242 | 17.4 |
| Lithobates neovolcanicus | 28,670 | 93 | 5,137 | 17.9 |
| Lithobates spectabilis | 24,821 | 81 | 3,893 | 15.6 |
| Rheohyla miotympanum | 18,056 | 59 | 3,516 | 19.4 |
| Smilisca baudinii | 7,631 | 25 | 1,579 | 20.6 |
| Spea multiplicata | 30,661 | 99.8 | 5,264 | 17.1 |
| Mammals | ||||
| Choeronycteris mexicana | 30,608 | 99.69 | 5,242 | 17.12 |
| Corynorhynus mexicanus | 30,608 | 99.69 | 5,242 | 17.12 |
| Dipodomys ornatus | 18,553 | 60.43 | 3,429 | 18.48 |
| Leptonycteris nivalis | 30,608 | 99.69 | 5,242 | 17.12 |
| Leptonycteris yerbabuenae | 24,955 | 81.28 | 4,474 | 17.93 |
| Lepus callotis | 28,469 | 92.73 | 5,025 | 17.65 |
| Peromyscus difficilis | 30,142 | 98.18 | 5,225 | 17.34 |
| Peromyscus melanophrys | 29,606 | 96.43 | 5,227 | 17.65 |
| Peromyscus melanotis | 29,231 | 95.21 | 5,183 | 17.73 |
| Rhogessa alleni | 17,604 | 57.34 | 3,353 | 19.05 |
| Sciurus oculatus | 14,564 | 47.44 | 1,923 | 13.20 |
| Sigmodon leucotis | 18,215 | 59.33 | 3,139 | 17.23 |
| Sorex saussurei | 4,151 | 13.52 | 756 | 18.22 |

Figure 5. Richness map of amphibians intersected with the kernel density of recurrence of the wildfires in Guanajuato, Mexico. Black polygons represent the Protected Natural Areas.
1. Palenque, 2. Peña Alta, 3. Sierra de Pénjamo, 4. Sierra de los Agustinos, 5. Las Fuentes, 6. Sierra de Lobos, 7. Las Musas, 8. Lago Cráter La Joya, 9. Cerro de los Amoles, 10. Parque Metropolitano, 11. Cerro de Arandas, 12. Cuenca Alta del Río Temascatio, 13. Cerro del Cubilete, 14. Cerros El Culiacán y La Gavia, 15. Cuenca de La Esperanza, 16. Mega Parque de la Ciudad de Dolores Hidalgo, 17. Presa La Purísima y su Zona de Influencia, 18. Presa de Neutla y su Zona de Influencia, 19. Laguna de Yuriria y su Zona de Influencia, 20. Pinal de Zamorano, 21. Región Volcánica Siete Luminarias, 22. Sierra Gorda de Guanajuato, 23. Cuenca de la Soledad, 24. Presa de Silva y Áreas Aledañas.
Respect to the temporal distribution of the recurrence of forest fires, for the period of time analyzed, the years 2017, 2019, and 2021 had the highest number of fires (72, 110 and 150, respectively). The map of kernel density is shown in Supplementary material: Figure 3S. The map was transformed to a binary map and overlapped with the patterns of richness of amphibians and mammals, to produce the maps in figures 5, 6.
The evaluation of the effects of the wildfires on the model of each species is shown in Table 3. The mean percentage of burned potential distribution area was 16.49 and 17.37 for amphibians and mammals, respectively. Some species’ distribution areas were more strongly affected by fires, such as Eleutherodactylus nitidus, Hypopachus variolosus, Lithobates megapode, and Smilisca baudinii, all of which were amphibians for which more than 20% of their distribution area had been burned. For mammals, the most affected species was Rhogessa alleni (19.05%), followed by Sorex saussurei (18.22%).
The area of Guanajuato affected by fires measured nearly 5,200 km2 (17%; Figs. 5, 6), with high diversity zones for amphibians located in the northwest, near Sierra de Lobos (PNA 6) and Peña Alta (PNA 2). Other important affected areas for amphibians coincided with high recurrence of wildfires in the southern of Guanajuato in Región Volcánica Siete Luminarias (PNA 21), Sierra de los Agustinos (PNA 4) and Cerro de los Amoles (PNA 9). For mammals, some of the most strongly affected areas coincided with those of the amphibians (e.g., within Cerro de los Amoles; PNA 9), but there were also areas that were unique to mammals (Fig. 6). For example, there were areas of high mammal richness with wildfires in central Guanajuato, which did not coincide with any PNA, as well as southeastern areas in Sierra de los Agustinos (PNA 4). Fortunately, areas with high richness for both amphibians and mammals were not affected by fires, like Sierra de Lobos (PNA 6), Cuenca de la Esperanza (PNA 15), and Cuenca de la Soledad (PNA 23).
Discussion
Linnean shortfalls in the state of Guanajuato could have medium effects because the estimator predicted at least 2 additional species for each taxon relative to total currently known. This suggests that the current species inventories are not yet complete. This finding does not dismiss possible shortfalls at more detailed scales, because the number of records within the state of Guanajuato is very low, with an average of 30 per each species of amphibian and only 6 of each species of mammal. It would therefore be informative to carry out more specific analyses within the quadrats where 0 or 1 species were recorded. Increased collection effort in the field could improve the problems of undersampling, since the number of total data points in Guanajuato is very low for some species (v. gr. Aquiloeurycea cephalica with 2 records, and Leptonycteris nivalis with 1 record; Table 1). It is interesting to highlight that when performing the analyses with SDM, the Linnean shortfall is apparently corrected (Table 2). However, these results should be taken with caution, because it is possible that there are commission errors in models or that those areas actually correspond to sister species (Rodrigues et al., 2019; Acevedo et al., 2014).
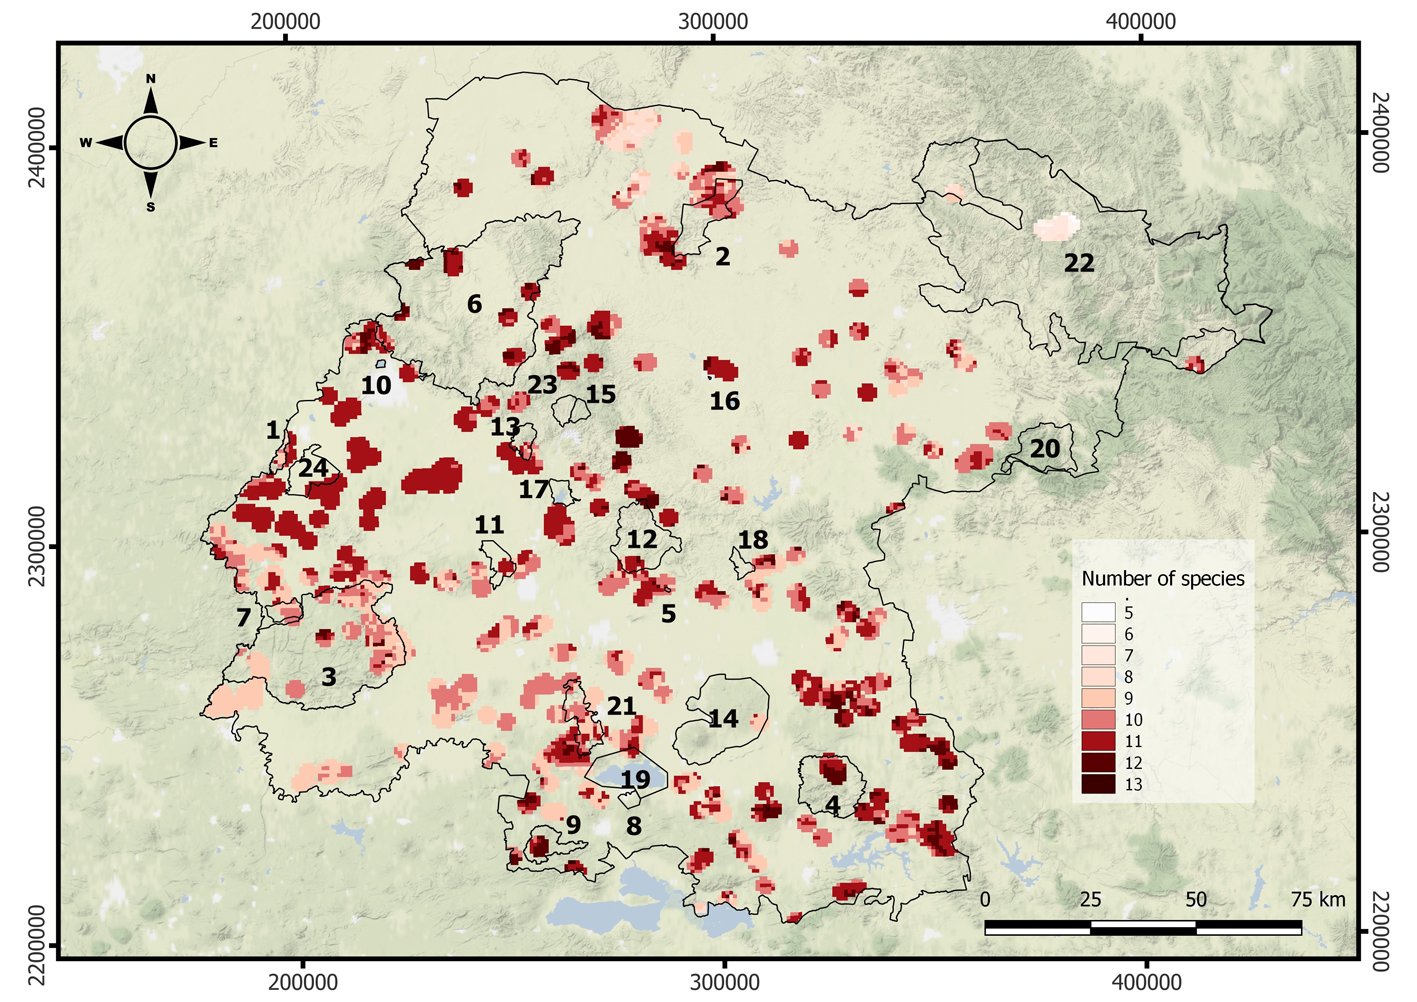
Figure 6. Richness map of mammals intersected with the kernel density of recurrence of the wildfires in Guanajuato, Mexico. Black polygons represent the Protected Natural Areas.
1. Palenque, 2. Peña Alta, 3. Sierra de Pénjamo, 4. Sierra de los Agustinos, 5. Las Fuentes , 6. Sierra de Lobos, 7. Las Musas, 8. Lago Cráter La Joya, 9. Cerro de los Amoles, 10. Parque Metropolitano, 11. Cerro de Arandas, 12. Cuenca Alta del Río Temascatio, 13. Cerro del Cubilete, 14. Cerros El Culiacán y La Gavia, 15. Cuenca de La Esperanza, 16. Mega Parque de la Ciudad de Dolores Hidalgo, 17. Presa La Purísima y su Zona de Influencia, 18. Presa de Neutla y su Zona de Influencia, 19. Laguna de Yuriria y su Zona de Influencia, 20. Pinal de Zamorano, 21. Región Volcánica Siete Luminarias, 22. Sierra Gorda de Guanajuato, 23. Cuenca de la Soledad, 24. Presa de Silva y Áreas Aledañas.
On the other hand, the Wallacean shortfall was highly relevant for both amphibians and mammals, showing poor quality. Murguía-Romero and Villaseñor (2000) suggested that the quality of the records is related to the geographical resolution of the biogeographical analysis. In future analysis within the state of Guanajuato and using smaller quadrats (for example, close in size to the pixels of our models), the Wallacean shortfall could strongly affect the observed data, reaching very poor data quality. Thus, it seems to be the more important shortfall for these vertebrate species.
For our 25 species, probably the effect of the Linnean shortfall has a less dramatic effect than the Wallacean shortfall. There are multiple potential explanations for these shortfalls, including low intensity and spatial variation of sampling, which can directly affect biodiversity estimators like species richness (Oliveira et al., 2016). Continuing the study of these shortfall will be important for the correct implementation of conservation strategies, for example with other methods including correlations using the sampling effort (Oliveira et al., 2016), rate of descriptions and number of taxonomists (Joppa et al., 2011), many different algorithms of species distribution modeling and maps of ignorance (Oliveira et al., 2016; Rocchini et al., 2011; Tessarolo et al., 2021), among others.
In spite of the extant Wallacean shortfalls, the richness patterns for both taxa were partially recognized; specially, the recorded most richness quadrats at 0.25º also showed the modeled pattern for amphibians. For mammals, the highest richness area near to Cuenca de la Esperanza was identified also for a quadrat of 0.25º, coinciding with the models. Amphibians and mammals shared many (though not all) areas of high richness, generally following a northwest-southeast diagonal across the state. The partial similarity in those richness patterns could be useful in Systematic Conservation Planning, because both taxa could represent each other as good surrogates (Escalante et al., 2020).
In general, amphibians and mammals are over-represented taxa in databases, although amphibians are less represented than mammals (Troudet et al., 2017). Few articles have quantified the Linnean and Wallacean shortfalls prior to biogeographic analysis. In particular, Oliveira et al.(2016) suggested that terrestrial vertebrates have similar biases compared with some taxa of arthropods, contradicting the statement that terrestrial vertebrates are better suited for biogeographic and conservation studies. In some places, such as the state of Guanajuato, amphibians and mammals could have similar Linnean shortfalls, but differ in the severity of their Wallacean shortfalls, which could modify the biogeographic patterns identified.
The relevance of including shortfall analysis in biogeographical studies, mainly in those related to species conservation, lies in the fact that the Linnean and Wallacean shortfalls strongly influence the possible results, since the data on the identity and distribution of the species are crucial to identify patterns in biodiversity, as well as the processes that modify those patterns (Hortal et al., 2015). In particular, Wallacean shortfalls can also alter estimates of threatened conservation status, since range size is regularly used in conservation (Hortal et al., 2015). Species with small ranges have higher priority in many international and national standards (DOF, 2010; IUCN, 2012). Therefore, Wallacean shortfalls could lead to some taxa and areas being disproportionately prioritized over others because their distribution areas have been erroneously underestimated (Riddle et al., 2011). In addition, other shortfalls that potentially can affect the biogeographic patterns should be investigated, like Darwinian shortfall (Diniz-Filho et al., 2013, 2023), and even distinct categories of Linnean shortfalls (Vergara-Asenjo et al., 2023).
As we expected, wildfires affected all species, but in different ways. For amphibians, the species Smilisca baudinii, in addition to having a small distribution area in Guanajuato compared to the rest of the species, is one of the most affected by wildfires occurrences. These observations may suggest that Smilisca baudinii should be considered a priority species for conservation in the state of Guanajuato. Furthermore, we also highlight Lithobates megapoda, which is listed in the 2019 update of the NOM-059-SEMARNAT-2010 (DOF, 2019) as a species under special protection and described as sensitive to habitat degradation (Santos-Barrera & Flores-Villela, 2004).
On the other hand, in the northeastern part of the state, the effects seem to be minimal compared to the south and southwest, but it is important to remember that species with specific habitat requirements such as Incilius nebulifer, Lithobates berlandieri, and Smilisca baudinii are distributed in this area. Therefore, attention should be paid to investigating the sources of ignition present at this area in order to prevent future wildfires, since the loss of habitat could result in the disappearance of these species. Finally, in accordance with Clivillé et al.(1997), who describe the effect of fires on amphibians from 3 points of view (habitat, species and individual), our study only focuses on the effect of these events on the habitat. Thus, the effects on the distribution of the selected species can be interpreted as loss of habitat and vegetation cover, trophic resources and humidity due to wildfires, which are determining characteristics for the presence of amphibians and their reproduction (Clivillé et al., 1997).
For the case of mammals, Sorex saussurei (the Saussure’s shrew) is the species with the narrowest geographic distribution in Guanajuato. This shrew is only distributed in Mexico and Guatemala, and even though it is considered as least concern on the Red List of Threatened Species (IUCN, 2017), some populations in Mexico have been categorized as threatened and under special protection (DOF, 2019). Secondly, Peters’s squirrel Sciurus oculatus occupies less than 50% of the surface of Guanajuato and is also categorized as least concern in the Red List of Threatened Species (IUCN, 2016). Sciurus oculatus is found only within Mexico, and is under special protection in national legislation NOM-059-SEMARNAT-2010, update of 2019 (DOF, 2019). Both species face continuing decline in the extent and quality of habitat due to land use change (Conafor, 2020; IUCN, 2016, 2017), which is exacerbated by repeated burning episodes that decrease the area occupied by each species by 13-18%. According to Zamudio (2012), most of the plant communities in the state of Guanajuato have significantly changed in their structure, floristic composition and physiognomy. Consequently, their distribution areas have been gradually reduced. Currently, 63% of the territory has been transformed into agricultural areas, human settlements, and areas devoid of vegetation (Roth et al., 2016).
The recurrence of wildfires, mainly in the southern part of Guanajuato, represents an important threat to biodiversity conservation within PNA, which are surrounded by a complex matrix of rainfed and irrigated agricultural land uses. This result was also found by Farfán et al. (2020, 2021), where both the probabilities of anthropogenic ignition and climate under the ENSO climate conditions lead to high wildfire risk in this region of the state. These PNA urgently need fire management plans that can integrate fire prevention actions at the local level in the context of global warming. On a global scale, wildfires have been responsible for up to 27% of the loss of tree cover between 2001 and 2021 (Tyukavina et al., 2022). In Mexico alone, in 2021, 408.75 km2 of forest were lost due to fire (Tyukavina et al., 2022). The effects of wildfires on biodiversity patterns could be understimated if these shortfalls are underestimating the biodiversity. Therefore, actions at the international level are also urgent in order to prevent damage to unknown biogeographic patterns.
This is the first study for the state of Guanajuato and for Mexico that addresses the effect of wildfire on the potential distribution of 2 important taxonomic groups: amphibians and mammals. The evaluation of the Linnean and Wallacean shortfalls for any taxonomic group is essential before the identification of geographic patterns involved as criteria for conservation planning, even in terrestrial vertebrates which are assumed to be adequately sampled. The Wallacean shortfall could lead to underestimations of the effects of perturbations such as wildfires. This is particularly true of species that are already vulnerable due to anthropogenic factors such as land cover change, illegal trafficking, etc., as well as intrinsic factors like the size of their natural distributional areas, because it is unknown whether undersampling could represent geographically rare species. Improving the biogeographical knowledge of the patterns of amphibians and mammals could provide better tools to stakeholders in order to generate fire management plans to prevent the negative impact of the wildfire within protected areas around the world.
Acknowledgements
We thank Julián A. Velasco and Luis J. Aguirre for their help with the parametrization of Maxent, and Miguel Murgía for assistance with the quantification of the Qs estimator. We also thank to the anonymous reviewers and the Associate Editor for their careful reading of this manuscript.
References
Acevedo, P., Melo-Ferreira, J., Real, R., & Alves, P. C. (2014). Evidence for niche similarities in the allopatric sister species Lepus castroviejoi and Lepus corsicanus. Journal
of Biogeography, 41, 977–986. https://doi.org/10.1111/jbi.12
270
Aiello-Lammens, M. E., Boria, R. A., Radosavljevic, A., Vilela, B., & Anderson, R. P. (2015). spThin: an R package for spatial thinning of species occurrence records for use in ecological niche models. Ecography, 38,541–545. https://doi.org/10.1111/ecog.01132
Barlow, J., Berenguer, E., Carmenta, R. & França, F. (2020). Clarifying Amazonia’s burning crisis. Global Change Biology, 26, 319–321. https://doi.org/10.1111/gcb.14872op
Bivand, R., Keitt, T., Rowlingson, B., Pebesma, E., Sumner, M., Hijmans, R. et al. (2015). Package ‘rgdal’. Bindings for the Geospatial Data Abstraction Library. Retrieved on December, 2020 from: http://rgdal.r-forge.r-project.org
Chisholm, R. A., Wijedasa, L. S., & Swinfield, T. (2016). The need for long-term remedies for Indonesia’s forest fires. Conservation Biology, 30, 5–6. https://doi.org/10.1111/cobi.
12662
Chuvieco, E., Giglio, L. & Justice, C. (2008). Global characterization of fire activity: toward defining fire regimes from Earth observation data. Global Change Biology, 14, 1488–1502. https://doi.org/10.1111/j.1365-2486.2008.01585.x
Clivillé, S., Montori, A., Llorente, G. A., Santos, X., & Carretero, M. A. (1997). El impacto de los incendios forestales sobre los anfibios. Quercus, 138,10–13.
Cobos, M. E., Peterson, A. T., Barve, N., & Osorio-Olvera, L. (2019). Kuenm: An R package for detailed development of ecological niche models using Maxent. PeerJ, 7,e6281. https://doi.org/10.7717/peerj.6281
Colwell, R. K., & Coddington, J. A. (1994). Estimating terrestrial biodiversity through extrapolation. Philosophical Transactions of the Royal Society B, 345, 101–118. https://doi.org/10.1098/rstb.1994.0091
Conabio (Comisión Nacional para el Conocimiento y Uso de la Biodiversidad). (2012). La biodiversidad en Guanajuato: estudio de estado (Vol. II). Guanajuato, Mexico: Comisión Nacional para el Conocimiento y Uso de la Biodiversidad (Conabio)/ Instituto de Ecología del Estado de Guanajuato (IEE).
Conafor (Comisión Nacional Forestal). (2020). Estimación de la tasa de deforestación bruta en México para el periodo 2001-2018 mediante el método muestreo. Documento técnico. Comisión Nacional Forestal. Jalisco, México. Retrieved in 2022 from: http://www.conafor.gob.mx:8080/documentos/docs/1/7768Documento%20tecnico%202020%20Deforestacion%20Bruta%20Final.pdf
DOF (Diario Oficial de la Federación). (2010). NORMA
Oficial Mexicana NOM-059-SEMARNAT-2010, Protección ambiental-Especies nativas de México de flora y fauna silvestres-Categorías de riesgo y especificaciones para
su inclusión, exclusión o cambio-Lista de especies en
riesgo. Mexico City, Mexico. Retrieved on March 3rd, 2021 from: https://dof.gob.mx/nota_detalle_popup.php?
codigo=5173091
DOF (Diario Oficial de la Federación). (2019). Modificación del Anexo Normativo III, Lista de especies en riesgo de la Norma Oficial Mexicana NOM-059-SEMARNAT-2010, Protección ambiental-Especies nativas de México de flora y fauna silvestres-Categorías de riesgo y especificaciones para su inclusión, exclusión o cambio-Lista de especies en riesgo, publicada el 30 de diciembre de 2010. Secretaría de Gobernación (SEGOB). Mexico City, Mexico. Retrieved on March 03rd, 2021 from: https://www.dof.gob.mx/nota_detalle.php?codigo=5578808&fecha=14/11/2019#gsc.tab=0
Diniz-Filho, J. F, Jardim, L., Guedes, J. J., Meyer, L., Stropp, J., Frateles, L. E. et al. (2023). Macroecological links between the Linnean, Wallacean, and Darwinian shortfalls. Frontiers of Biogeography, 15, e59566. http://dx.doi.org/10.21425/F5FBG59566
Diniz-Filho, J. A. F., Loyola, R. D., Raia, P., Mooers, A. O., & Bini, L. M. (2013) Darwinian shortfalls in biodiversity conservation. Trends in Ecology and Evolution, 28, 689–695. https://doi.org/10.1016/j.tree.2013.09.003
Escalante, T., Noguera-Urbano, E. A., & Corona, W. (2018). Track analysis of the Nearctic region: Identifying complex areas with mammals. Journal of Zoological Systematics and Evolutionary Research, 56, 466–477. https://doi.org/10.1111/jzs.12211
Escalante, T., Varela-Anaya, A. M., Noguera-Urbano, E. A., Elguea-Manrique, L. M., Ochoa-Ochoa, L. M., Gutiérrez-Velázquez, A. L. et al. (2020). Evaluation of five taxa as surrogates for conservation prioritization in the Trans-
mexican Volcanic Belt, México. Journal for Nature Conservation, 54, e125800. https://doi.org/10.1016/j.jnc.20
20.125800
Farfán, M., Pérez-Salicrup, D. R., Flamenco-Sandoval, A., Nicasio-Arzeta, S., Mas, J. F., & Ramírez-Ramírez, I. (2018). Modeling anthropic factors as drivers of wildfire occurrence at the Monarch Butterfly Biosphere. Madera y Bosques, 24, 1–15. https://doi.org/10.21829/myb.2018.2431591
Farfán, M., Flamenco-Sandoval, A., Rodríguez-Padilla, C. R., Rodrigues-de Sousa Santos, L., González-Gutiérrez, I., & Gao, Y. (2020). Cartografía de la probabilidad de ocurrencia a incendios forestales para el estado de Guanajuato: Una aproximación antrópica de sus fuentes de ignición. Acta Universitaria, 30, 1–15. https://doi.org/10.15174/au.2020.2953
Farfán, M., Domínguez, C., Espinoza, A., Jaramillo, A., Alcántara, C., Maldonado, V. et al. (2021). Forest fire probability under ENSO conditions in a semi-arid region: a case study in Guanajuato. Environmental Monitoring and Assessment, 193, 1–14. https://doi.org/10.1007/s10661-021-09494-0
Farrús, M., Anguita, J., Hernando, J., & Cerdà, R. (2007). Fusión de sistemas de reconocimiento basados en características de alto y bajo nivel. In III Congreso da Sociedade Española de Acústica Forense: actas do Congreso; 2005 oct 27-28; Santiago de Compostela, España. Santiago de Compostela: Dirección Xeral de Creación e Difusión Cultural.
Ferreira, B. M., Soares-Filho, B. S., & Quintão, F. M. (2019). The Dinamica EGO virtual machine. Science of Computer Programming, 173,3–20. https://doi.org/10.1016/j.scico.20
18.02.002
Fick, S. E., & Hijmans, R. J. (2017). WorldClim 2: new 1-km spatial resolution climate surfaces for global land areas. International Journal of Climatology, 37,4302–4315. https://doi.org/10.1002/joc.5086
Flores-Villela, O., & Ochoa-Ochoa, L. M. (2020). Compilación de bases de datos de la herpetofauna mexicana. Museo de Zoología “Alfonso L. Herrera”, Facultad de Ciencias, Universidad Nacional Autónoma de México. Ciudad de México.
GBIF.org. (2020a). GBIF Occurrence Download. Retrieved on November 11th, 2020 from: https://doi.org/10.15468/dl.
bbt2tq
GBIF.org. (2020b). GBIF Occurrence Download. Retrieved on November 11th, 2020 from: https://doi.org/10.15468/dl.
j9evdt
GBIF.org. (2020c). GBIF Occurrence Download. Retrieved on November 11th, 2020 from: https://doi.org/10.15468/dl.
z8nbtw
GBIF.org. (2020d). GBIF Occurrence Download. Retrieved on November 11th, 2020 from: https://doi.org/10.15468/dl.
x4qxcx
GBIF.org. (2020e). GBIF Occurrence Download. Retrieved on November 11th, 2020 from: https://doi.org/10.15468/dl.
apt9wm
GBIF.org. (2020f). GBIF Occurrence Download. Retrieved on November 11th, 2020 from: https://doi.org/10.15468/dl.
bugsgy
GBIF.org. (2020g). GBIF Occurrence Download. Retrieved on November 11th, 2020 from: https://doi.org/10.15468/dl.
x33mhm
GBIF.org. (2020h). GBIF Occurrence Download. Retrieved on November 11th, 2020 from: https://doi.org/10.15468/dl.
esbshy
GBIF.org. (2020i). GBIF Occurrence Download. Retrieved on November 11th, 2020 from: https://doi.org/10.15468/dl.
ju93kd
GBIF.org. (2020j). GBIF Occurrence Download. Retrieved on November 11th, 2020 from: https://doi.org/10.15468/dl.
jrv9uw
GBIF.org. (2020k). GBIF Occurrence Download. Retrieved on November 11th, 2020 from: https://doi.org/10.15468/dl.
gmjecq
GBIF.org. (2020l). GBIF Occurrence Download. Retrieved on November 11th, 2020 from: https://doi.org/10.15468/dl.
q7kvhy
GBIF.org. (2020m). GBIF Occurrence Download Retrieved on November 11th, 2020 from: https://doi.org/10.15468/dl.
jjrncx
GBIF.org. (2020n). GBIF Occurrence Download. Retrieved on November 11th, 2020 from: https://doi.org/10.15468/dl.
7hypb5
GBIF.org. (2020o). GBIF Occurrence Download Retrieved on November 11th, 2020 from: https://doi.org/10.15468/dl.
vncwkt
GBIF.org. (2020p). GBIF Occurrence Download. Retrieved on November 11th, 2020 from: https://doi.org/10.15468/dl.
sbrrgp
GBIF.org. (2020q). GBIF Occurrence Download. Retrieved on November 11th, 2020 from: https://doi.org/10.15468/dl.
t6y7vb
GBIF.org. (2020r). GBIF Occurrence Download. Retrieved on November 11th, 2020 from: https://doi.org/10.15468/dl.
ksdpx3
GBIF.org. (2020s). GBIF Occurrence Download. Retrieved on November 11th, 2020 from: https://doi.org/10.15468/dl.
uy2d7k
GBIF.org. (2020t). GBIF Occurrence Download. Retrieved on November 11th, 2020 from: https://doi.org/10.15468/dl.
py7yby
GBIF.org. (2020u). GBIF Occurrence Download. Retrieved on November 11th, 2020 from: https://doi.org/10.15468/dl.
8c8umf
GBIF.org. (2020v). GBIF Occurrence Download. Retrieved on November 11th, 2020 from: https://doi.org/10.15468/dl.
t92jw8
GBIF.org. (2020w). GBIF Occurrence Download. Retrieved on December 7th, 2020 from: https://doi.org/10.15468/dl.
wumbut
GBIF.org. (2020x) GBIF Occurrence Download. Retrieved on December 7th, 2020 from: https://doi.org/10.15468/dl.8tc8xr
GBIF.org. (2020y). GBIF Occurrence Download. Retrieved on December 7th, 2020 from: https://doi.org/10.15468/dl.
tb25b4
GBIF.org. (2020z). GBIF Occurrence Download. Retrieved on December 7th, 2020 from: https://doi.org/10.15468/dl.
paayuf
GBIF.org. (2020aa). GBIF Occurrence Download. Retrieved on December 7th, 2020 from: https://doi.org/10.15468/dl.
8fzeuv
GBIF.org. (2020ab). GBIF Occurrence Download. Retrieved on December 7th, 2020 from: https://doi.org/10.15468/dl.
vfa2qq
GBIF.org. (2020ac). GBIF Occurrence Download. Retrieved on December 7th, 2020 from: https://doi.org/10.15468/dl.
ug5cus
GBIF.org. (2020ad). GBIF Occurrence Download. Retrieved on December 7th, 2020 from: https://doi.org/10.15468/dl.
gpsjwg
GBIF.org. (2020ae). GBIF Occurrence Download. Retrieved on December 7th, 2020 from: https://doi.org/10.15468/dl.
4ufzz3
GBIF.org. (2020af). GBIF Occurrence Download. Retrieved on December 7th, 2020 from: https://doi.org/10.15468/dl.
dwvs69
GBIF.org. (2020ag). GBIF Occurrence Download. Retrieved on December 7th, 2020 from: https://doi.org/10.15468/dl.
upjycdg
GBIF.org. (2022ah). GBIF Occurrence Download. Retrieved on December 7th, 2020 from: https://doi.org/10.15468/dl.6tt8z6
Geary, W. L., Tulloch, A. I. T., Ritchie, E. G., Doherty, T. S., Nimmo, D. G., Maxwell, M. A. et al. (2023). Identifying historical and future global change drivers that place species recovery at risk. Global Change Biology, 29, 2953–2967. https://doi.org/10.1111/gcb.16661
González, T. M., González-Trujillo, J. D., Muñoz, A., & Armenteras, D. (2021). Differential effects of fire on the occupancy of small mammals in neotropical savanna-gallery forests. Perspectives in Ecology and Conservation, 19, 179–188. https://doi.org/10.1016/j.pecon.2021.03.005
Gotelli, N. J., & Colwell, R. K. (2011). Estimating species richness. In A. E. Magurran, & B. J. McGill (Eds.), Biological diversity: frontiers in measurement and assessment (pp. 39–54). Oxfordshire, England: Oxford University Press.
He, T., Lamont, B. B., & Pausas, J. G. (2019). Fire as a key driver of Earth’s biodiversity. Biological Reviews, 94, 1983–2010. https://doi.org/10.1111/brv.12544
Hortal, J., De Bello, F., Diniz-Filho, J. A. F., Lewinsohn, T. M., Lobo, J. M., & Ladle, R. J. (2015). Seven Shortfalls that Beset Large-Scale Knowledge of Biodiversity. Annual Review of Ecology, Evolution, and Systematics, 46, 523–549. https://doi.org/10.1146/annurev-ecolsys-112414-054400
Hu, F. S., Higuera, P. E., Duffy, P., Chipman, M. L., Rocha, A. V., Young, A. M., & Dietze, M. C. (2015). Arctic tundra fires: natural variability and responses to climate change. Frontiers in Ecology and the Environment, 13, 369–377. https://doi.org/10.1890/150063
IUCN (International Union for Conservation of Nature). 2001. IUCN Red List categories and criteria: Version 3.1. Prepared by IUCN Species Survival Commission. World Conservation Union, Gland, Switzerland and Cambridge, United Kingdom.
IUCN (International Union for Conservation of Nature). (2012). IUCN Red List Categories and Criteria: Version 3.1. (2nd ed.). IUCN, Gland, Switzerland.
IUCN (International Union for Conservation of Nature). (2016). Sciurus oculatus. The IUCN Red List of Threatened Species. Retrieved in 2022 from: e.T20017A22246721. https://dx.doi.org/10.2305/IUCN.UK.2016-2.RLTS.T20017A22246721.en
IUCN (International Union for Conservation of Nature). (2017). Sorex saussurei. The IUCN Red List of Threatened Species. Retrieved in 2022 from: e.T41416A22317311. https://dx.doi.org/10.2305/IUCN.UK.2017-2.RLTS.T41416A22317311.en
Jain, A., Nandakumar, K., Ross, A. (2005). Score normalization in multimodal biometric systems. Pattern Recognition, 38, 2270–2285. https://doi.org/10.1016/j.patcog.2005.01.012
Joppa, L. N., Roberts, D. L., Myers, N., & Pimm, S. L. (2011). Biodiversity hotspots house most undiscovered plant species. Proceedings of the National Academy of Sciences, 108, 13171–13176. https://doi.org/10.1073/pnas.1109389108
Kass, J. M., Vilela, B., Aiello-Lammens, M. E., Muscarella, R., Merow, C., & Anderson, R. P. (2017). Wallace: A flexible platform for reproducible modeling of species niches and distributions built for community expansion. Methods in Ecology and Evolution, 9, 1151–1156. https://doi.org/10.1111/2041-210X.12945
Kelly, L. T., Giljohann, K. M., Duane, A., Aquilué, N., Archibald, S., Batllori, E. et al. (2020). Fire and biodiversity in the Anthropocene. Science, 370, 1–10. https://doi.org/10.1126/science.abb0355
Kindt, R., & Coe, R. (2005). Tree diversity analysis. A manual and software for common statistical methods for ecological and biodiversity studies. Nairobi, Kenya: World Agroforestry Centre (ICRAF).
Leyte-Manrique, A., Mata-Silva, V., Baez-Montes, O., Fucsko, L. A., DeSantis, D. L., Garcia-Padilla, E. et al. (2022). The herpetofauna of Guanajuato, Mexico: composition, distribution, and conservation status. Amphibian & Reptile Conservation, 16, 133–180.
Lomolino, M. V. (2004). Conservation biogeography. In M. V. Lomolino, & L. R. Heaney (Eds.), Frontiers of biogeography: new directions in the geography of nature (pp. 293–296). Sunderland, Massachusetts: Sinauer.
Luedtke, J. A., Chanson, J., Neam, K., Hobin, L., Maciel, A. O., Catenazzi, A. et al. (2023). Ongoing declines for the world’s amphibians in the face of emerging threats. Nature, 622, 308–314. https://doi.org/10.1038/s41586-023-06578-4
Mandeville, P. B. (2008). Tips bioestadísticos: tema 18 ¿Por qué se deben centrar las covariables en regresión lineal? Ciencia UANL, 11, 300–305.
Martínez-Torres, H., Cantú-Férnandez, M., Ramírez, M. I., & Pérez-Salicrup, D. R. (2015). Fires and fire management in the Monarch Butterfly Biosphere Reserve. In K. S. Oberhauser, K. R. Nail, & S. Altizer (Eds.), Monarchs in a changing world: biology and conservation of an iconic butterfly (pp. 179–189). Ithaca, New York: Cornell University Press.
Montgomery, D., & Peck, E. A. (1992). Introduction to linear regression analysis. Second Edition. Hoboken, Nueva Jersey: John Wiley & Sons Ltd.
Morrone, J. J., Escalante, T., & Rodríguez-Tapia, G. (2017). Mexican biogeographic provinces: map and shapefiles. Zootaxa, 4277, 277–279. https://doi.org/10.11646/zootaxa.
4277.2.8
Murguía-Romero, M., & Villaseñor, J. L. (2000). Estimating the quality of the records used in quantitative biogeography with presence-absence matrices. Annales Botanici Fennici, 37, 289–296.
Naimi, B., Hamm, N. A. S., Groen, T. A., Skidmore, A. K., & Toxopeus, A. G. (2014). Where is positional uncertainty a problem for species distribution modelling? Ecography, 37, 191–203. https://doi.org/10.1111/j.1600-0587.2013.00205.x
Nasa Earth Data Cloud. (2020). Datos de incendios activos. NASA Official: Cerese Alber Retrieved on November 3rd, 2021 from: https://earthdata.nasa.gov/earth-observation-data/near-real-
time/firms/activefiredata
Oliveira, U., Paglia, A. P., Brescovit, A. D., de Carvalho, C. J. B., Silva, D. P., Rezende, D. T. et al. (2016). The strong influence of collection bias on biodiversity knowledge shortfalls of Brazilian terrestrial biodiversity. Diversity and Distributions, 22,1232–1244. https://doi.org/10.1111/ddi.12489
Osorio-Olvera, L., Lira-Noriega, A., Soberón, J., Peterson, A. T., Falconi, M., Contreras-Díaz, R. G. et al. (2020). NTBOX: an R package with graphical user interface for modelling and evaluating multidimensional ecological niches. Methods in Ecology and Evolution, 11, 1199-1206. https://doi.org/10.1111/2041-210X.13452
Pearson, R. G., Raxworthy, C. J., Nakamura, M., & Townsend, A. (2007). Predicting species distributions from small numbers of occurrence records: a test case using cryptic geckos in Madagascar. Journal of Biogeography, 34, 102–117. https://doi.org/10.1111/j.1365-2699.2006.01594.x
Peterson, A. T., Papeş, M., & Soberón, J. (2008). Rethinking receiver operating characteristic analysis applications in ecological niche modeling. Ecological Modelling, 213,63–72. https://doi.org/10.1016/j.ecolmodel.2007.11.008
Pilliod, D. S., Bury, R. B., Hyde, E. J., Pearl, C. A., & Corn, P. S. (2003). Fire and amphibians in North America. Forest Ecology and Management, 178, 163–181. https://doi.org/10.1016/S0378-1127(03)00060-4
Pyne, S. J. (2021). The Pyrocene: how we created an Age of Fire, and what happens next. Oakland, California: University of California Press.
QGIS Development Team. (2020). QGIS Geographic Information System. Open Source Geospatial Foundation Project. Beaverton, Oregon. Retrieved on March 2nd, 2021 from: https://qgis.org
Riddle, B. R., Ladle, R. J., Lourie, S. A., & Whittaker, R. J. (2011). Basic Biogeography: estimating biodiversity and mapping nature. In R. J. Ladle, & R. J. Whittaker (Eds.), Conservation Biogeography (pp. 45–92). Hoboken, New Jersey: Wiley-Blackwell. https://doi.org/10.1002/9781444390001.ch4
Rocchini, D., Hortal, J., Lengyel, S., Lobo, J. M., Jiménez-Valverde, A., Ricotta, C. et al. (2011). Accounting for uncertainty when mapping species distributions: the need for maps of ignorance. Progress in Physical Geography: Earth and Environment, 35, 211–226. https://doi.org/10.
1177/0309133311399491
Rodrigues, J. F. M., Villalobos, F., Iverson, J. B., & Diniz-Filho, J. A. F. (2019). Climatic niche evolution in turtles is characterized by phylogenetic conservatism for both aquatic and terrestrial species. Journal of Evolutionary Biology, 32,66–75. https://doi.org/10.1111/jeb.13395
Roth, D., Moreno-Sánchez, R., Torres-Rojo, J. M., & Moreno-Sánchez, F. (2016). Estimation of human induced disturbance of the environment associated with 2002, 2008 and 2013 land use/cover patterns in Mexico. Applied Geography, 66, 22–34. https://doi.org/10.1016/j.apgeog.2015.11.009
RStudio Team. (2020). RStudio: integrated development for R. RStudio, PBC, Boston, Massachusetts. Retrieved in 2020 from: http://www.rstudio.com/
Salazar, D. N., Farfán-Gutiérrez, M., & Arellano-Reyes, M. A. (2019). Cartografía de la severidad de los incendios forestales (2017, 2018, 2019) en el estado de Guanajuato empleando imágenes Sentinel-2. Jóvenes en la Ciencia, 5, 1-6.
Sánchez O., Charre-Medellín, J. F., Téllez-Girón, G., Báez-Montes, Ó., & Magaña-Cota, G. (2016). Mamíferos silvestres de Guanajuato: actualización taxonómica y diagnóstico de conservación. In M. Briones-Salas, Y. Hortelano-Moncada, G. Magaña-Cota, G. Sánchez-Rojas, & J. E. Sosa-Escalante, (Eds.), Riqueza y conservación de los mamíferos en México a nivel estatal (pp. 243–280). Mexico City: Instituto de Biología, UNAM/ Asociación Mexicana de Mastozoología/ Universidad de Guanajuato.
Santos-Barrera, G., & Flores-Villela, O. (2004). Lithobates megapoda. IUCN Red List of Threatened Species. Versión 2013.2. Cambridge, United Kingdom. Retrieved on April 1st, 2021 from: www.iucnredlist.org
SMAOT (Secretaría de Medio Ambiente y Ordenamiento Territorial). (2022). Áreas Naturales Protegidas. Gobierno del Estado de Guanajuato, Guanajuato. Retrieved on October 26th, 2022 from: https://smaot.guanajuato.gob.mx/sitio/areas-naturales-protegidas
Soberón, J., & Peterson, A. T. (2005). Interpretation of Models of Fundamental Ecological Niches and Species’ Distributional Areas. Biodiversity Informatics, 2, 1–10. https://doi.org/10.17161/bi.v2i0.4
Shlisky, A., Waugh, J., González, P., González, M., Manta, M., Santoso, H. et al. (2007). Fire, ecosystems and people: threats and strategies for global biodiversity conservation. Global Fire Initiative Technical Report 2007-2; Arlington, VA: The Nature Conservancy.
Tessarolo, G., Ladle, R. J., Lobo, J. M., Rangel, T. F. & Hortal, J. (2021), Using maps of biogeographical ignorance to reveal the uncertainty in distributional data hidden in species distribution models. Ecography, 44, 1743–1755. https://doi.org/10.1111/ecog.05793
Troudet, J., Grandcolas, P., Blin, A., Vignes-Lebbe, R., & Legendre, F. (2017). Taxonomic bias in biodiversity data and societal preferences. Scientific Reports, 7,1–14. https://doi.org/10.1038/s41598-017-09084-6
Tyukavina, A., Potapov, P., Hansen, M. C., Pickens, A. H., Stehman, S. V., Turubanova, S. et al. (2022). Global trends
of forest loss due to fire from 2001 to 2019. Frontiers
in Remote Sensing, 3,1–20. https://doi.org/10.3389/frsen.
2022.825190
United States Geological Survey (USGS). (2021). Archivo EROS de USGS-Elevación digital- Elevación global de 30 segundos de arco (GTOPO30). Retrieved on June 18th, 2021 from: https://www.usgs.gov/centers/eros/science/usgs-eros-archive-digital-elevation-global-30-arc-second-elevation-gtopo30
Vergara-Asenjo, G., Alfaro, F. M., & Pizarro-Araya, J. (2023) Linnean and Wallacean shortfalls in the knowledge of arthropod species in Chile: Challenges and implications for regional conservation. Biological Conservation, 281, 110027. https://doi.org/10.1016/j.biocon.2023.110027
Warren, D. L., & Seifert, S. N. (2011). Ecological niche modeling in Maxent: the importance of model complexity and the performance of model selection criteria. Ecological Applications, 21,335–342. https://doi.org/10.1890/10-1171.1
Zamudio, S. (2012). Diversidad de ecosistemas del estado de Guanajuato. In Comisión Nacional para el Conocimiento y Uso de la Biodiversidad (Conabio)/ Instituto de Ecología del estado de Guanajuato (IEE) (Eds.), La biodiversidad de Guanajuato: estudio de estado. II (pp. 19–55). Mexico City: Conabio/ IEE.